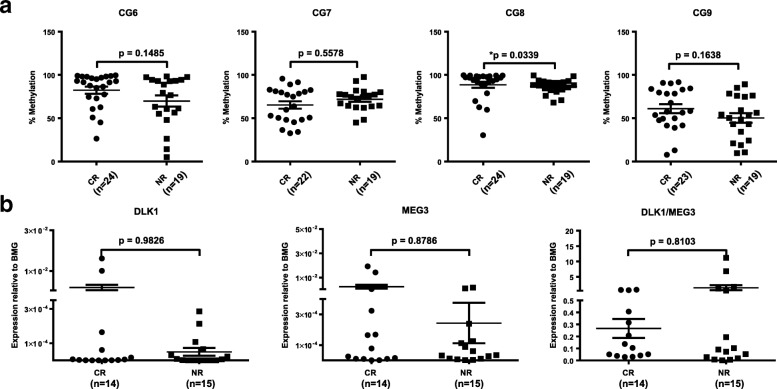
Fig. 2.
Differences in DLK1-MEG3 CpG site methylation and imprinted gene expression in AML MNCs based on patient response to first-round induction therapy. a Mann-Whitney analysis of AML patients’ response to treatment depending on the methylation values for particular CpG site amplicons. CR, complete remission; NR, non-responders. *p < 0.05. b Mann-Whitney analysis of AML patients’ response to treatment depending on DLK1, MEG3, and DLK1/MEG3 expression ratio values obtained by RT-qPCR. CR, complete remission; NR, non-responders

