
Fig. 2.
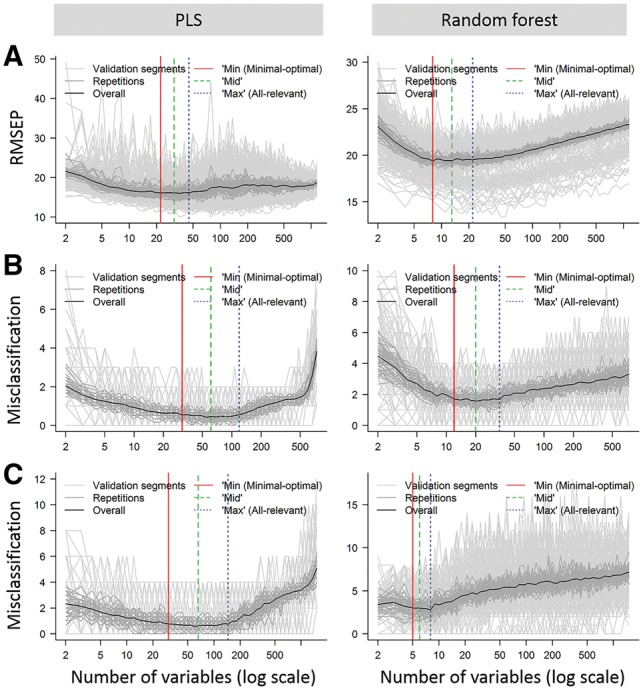
MUVR validation plots for identification of the all-relevant (‘max’ model) and minimal-optimal (‘min’ model) variables on three datasets: (A) ‘Freelive’, regression; (B) ‘Mosquito’, classification; (C) ‘Crisp’, multilevel. Results are presented for PLS (left) and random forest (right). Validation plots can be generated using the MUVR ‘plotVAL’ function