
Fig. 4.
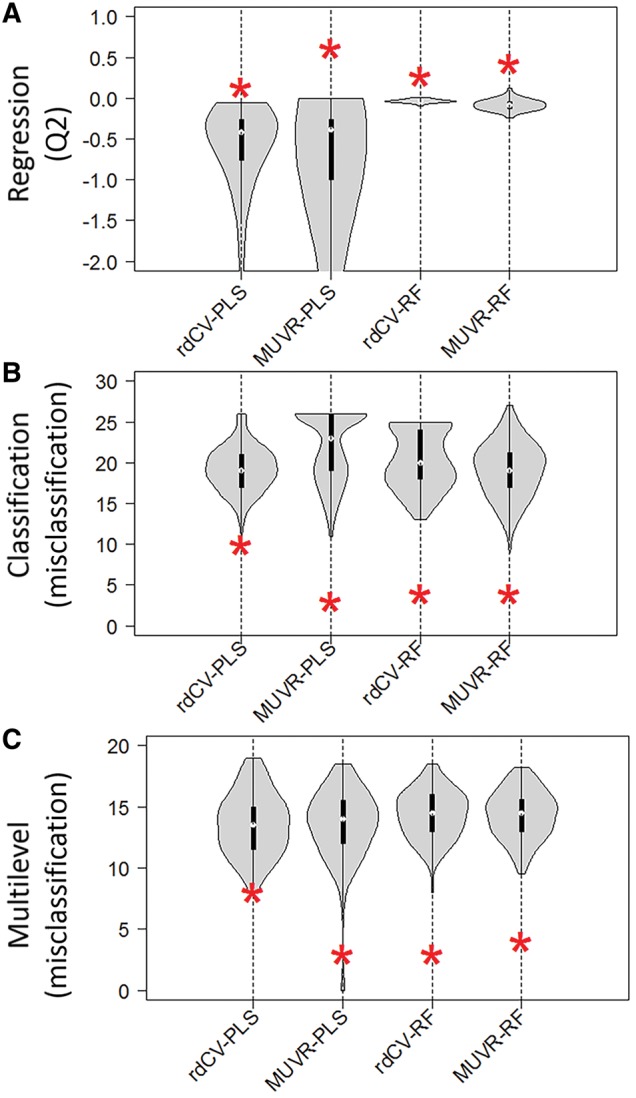
Performance of MUVR or repeated double cross-validation models (rdCV) built from actual data and random permutations for three datasets: (A) ‘Freelive’, regression; (B) ‘Mosquito’, classification; (C) ‘Crisp’, multi-level. The performance distributions of random permutations are represented as violin plots, with the asterisks representing actual model performance (Q2 for regression, number of misclassifications for classification and multilevel analysis)