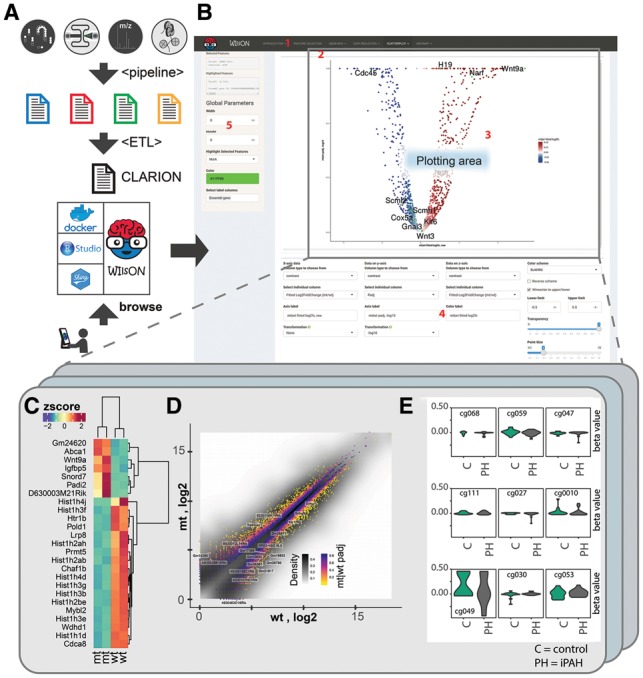
Fig. 1.

(A) The WIlsON workflow starting from the top: a screening platform generates raw data that is analyzed by a platform-specific software pipeline, providing a platform-specific result format (blue to yellow spreadsheets). An ETL (Extract, Transform, Load) process extracts relevant data generating a CLARION file, that is loaded into the WIlsON_App (containerized infrastructure-> Docker; local-> Rstudio; Client/Server -> Shiny). The end user can access the data with a web browser. (B) Screenshot of the WIlsON_App: the dashboard is divided into subsections as indicated, including a main selection panel (1), allowing data filtering and a plotting module selection. Plotting module specific submenus give access to plotting subtypes (i.e. static and interactive variants) (2); a general plotting area for all plots (3); a plot type specific parameter section (4); and a global parameter section and logging module (5). (C) Heatmap based on PRMT5 (Zhang et al., 2015) dataset: expression data from individual samples for both conditions (wt/mt) were selected, filtered for the top 25 genes considering the adjusted P-value denoting significant differential expression, and a row-wise z-score transformation was applied. Clustering was performed to rows and columns, and a ‘spectral’ color palette was selected. By choosing the static heatmap module, all labels were automatically scaled to be readable. (D) Scatterplot from PRMT5 (Zhang et al., 2015) dataset: all genes were selected and illustrated by choosing mean wt expression values for x axis and mean mutant signal for y axis. Both axes were selected to be log2 transformed. A third dimension was added via color coding based on the adjusted P-value using color palette ‘magma’. For a second data layer, all lncRNA were selected and 25 of these were picked for labeling using the gene symbol. (E) Violin plots from iPAH (Hautefort et al., 2017) dataset: all sites were filtered for nine methylation sites at chromosome 1 with proximity to gene MXRA8. Beta values for controls and all iPAH patients were chosen for grouping
