. 2019 Jan 10;10(9):2687–2692. doi: 10.1039/c8sc03479f

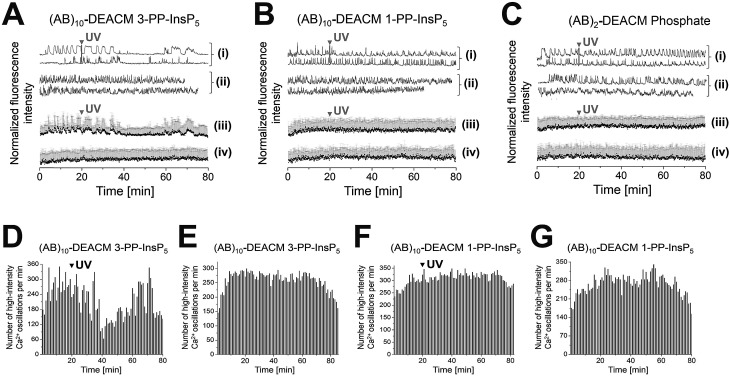
Fig. 4. Photolysis of (AB)10-DEACM 1-, 3-PP-InsP5 and of (AB)2-DEACM Phosphate in MIN6 cells. (A–C) Representative single (i + ii) and averaged (iii + iv) Ca2+ traces from MIN6 cells, recorded with the Ca2+ indicator Fluo-4. (i + iii) Photolysis and (ii + iv) -UV controls of (A) (AB)10-DEACM 3-PP-InsP5, (B) (AB)10-DEACM 1-PP-InsP5, and of (C) (AB)2-DEACM Phosphate. (D–G) Number of detected high-intensity Ca2+ events within every 60 s interval. (D) (AB)10-DEACM 3-PP-InsP5; (E) (AB)10-DEACM 3-PP-InsP5, -UV control; (F) (AB)10-DEACM 1-PP-InsP5; (G) (AB)10-DEACM 1-PP-InsP5, -UV control. For representative individual Ca2+ traces see ESI Fig. S5–S7. MIN6 cells were loaded with (AB)10-DEACM 1- and 3-PP-InsP5 (10 μM) for 4 h before imaging, which was conducted in the presence of 11 mM glucose. Photolysis: λ = 375 nm, 10 frames, 3.2 s frame time (indicated as: UV). n > 40 cells in 4 experiments. Error bars present SD.

Fig. 4