. 2019 Jan 9;10(9):2785–2790. doi: 10.1039/c8sc04854a

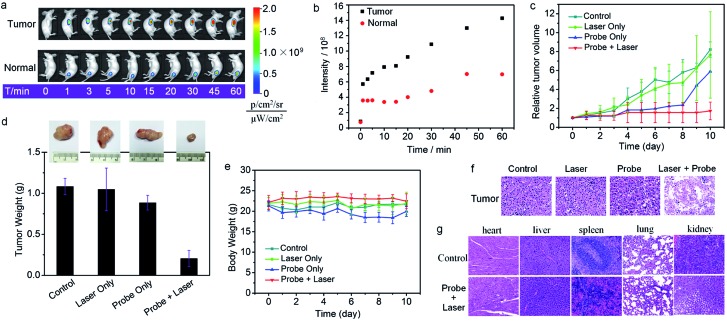
Fig. 4. (a) Tumor-specific activation of NIR fluorescence in a HCT116 tumor-bearing mouse treated with Nano-TNP-SO (25 nmol TNP-SO). Fluorescent images were taken at various time points after subcutaneous injection of Nano-TNP-SO into tumor and normal regions. (b) Region of interest measurements of the NIR fluorescence signal ratio between the tumor and the normal site injected with Nano-TNP-SO. (c) Tumor growth curves of mice in groups by administration of various treatments. (d) Tumor weight in different groups obtained on day 10 and the representative photographs of tumor tissues on day 10. (e) Body weight changes in mice with various treatments. (f) H&E staining for tumors of mice after various treatments. (g) H&E staining for major organs of mice without treatment and treated with Nano-TNP-SO and 530 nm light irradiation. Error bars represent the standard error of mean (n = 4).

Fig. 4