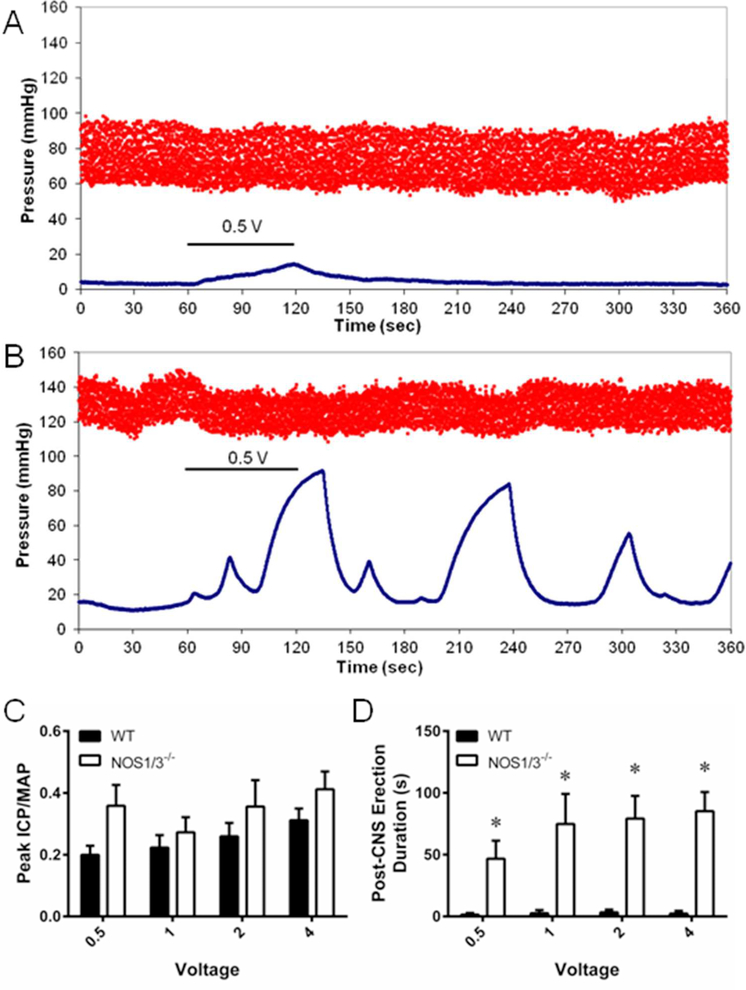
Fig. 1. Assessment of cavernous nerve stimulated erectile function and priapic activity in wild type and NOS1/3−/− mice.
Representative mean arterial pressure (MAP) and intracavernous pressure (ICP) tracings in response to 0.5 volts of cavernous nerve stimulation in (A) wild type (WT) and (B) NOS1/3−/− mice. (C) Assessment of erectile function by peak ICP/MAP following voltage dependent cavernous nerve stimulation. (D) Priapic activity assessed by erection duration following cavernous nerve stimulation. Data expressed as mean ± SEM for n = 7 animals per group. * P < 0.05 vs. WT.

