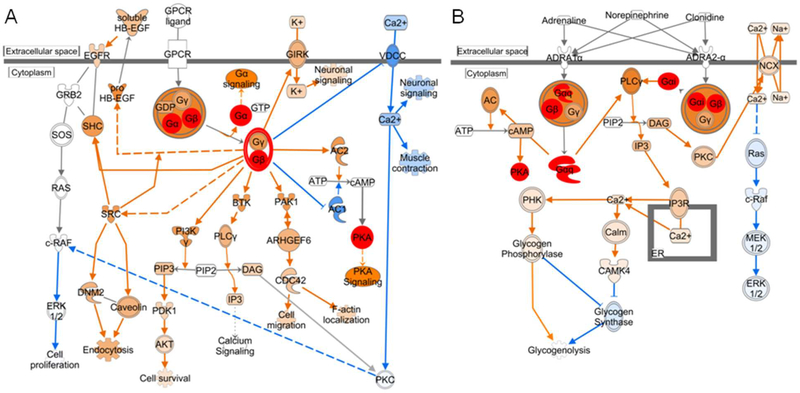
Fig. 5. Augmented G-protein signaling in the NOS1/3−/− penis.
Canonical pathways for (A) Gβγ signaling and (B) α-adrenergic signaling with activation predicted by the molecular activity predictor tool within IPA. Increased protein expression determined by spectral counting is denoted by red filled symbols. IPA determined predictions are denoted by orange (increased) and blue (decreased) filled symbols and connecting arrows. Solid arrows indicate direct action, hatched arrows indicate indirect action.

