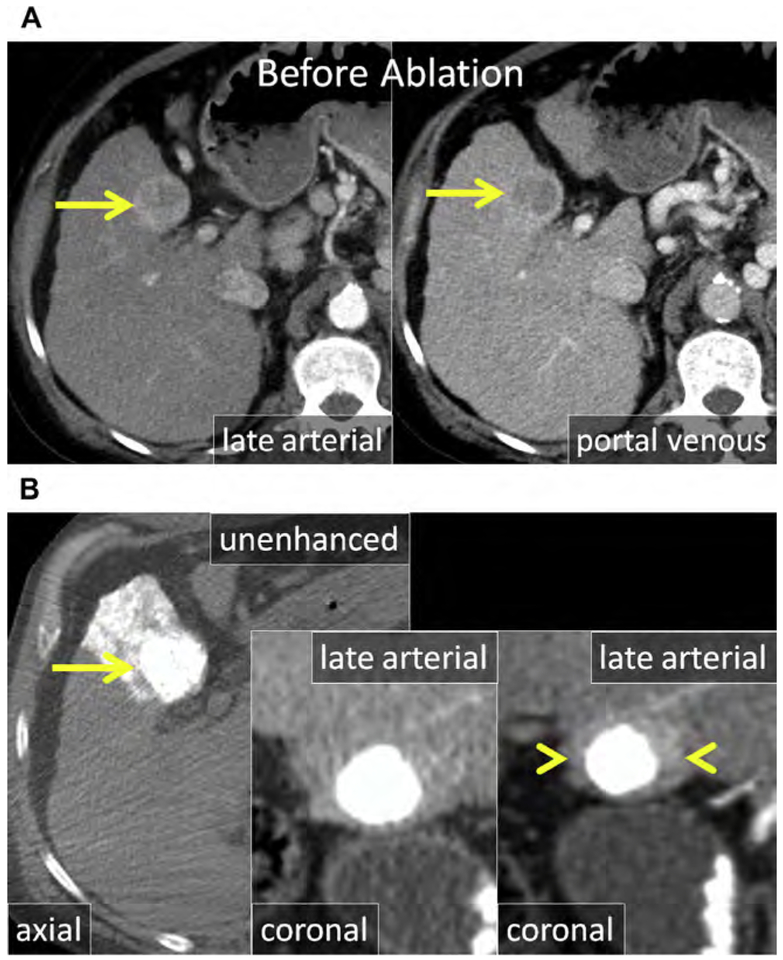
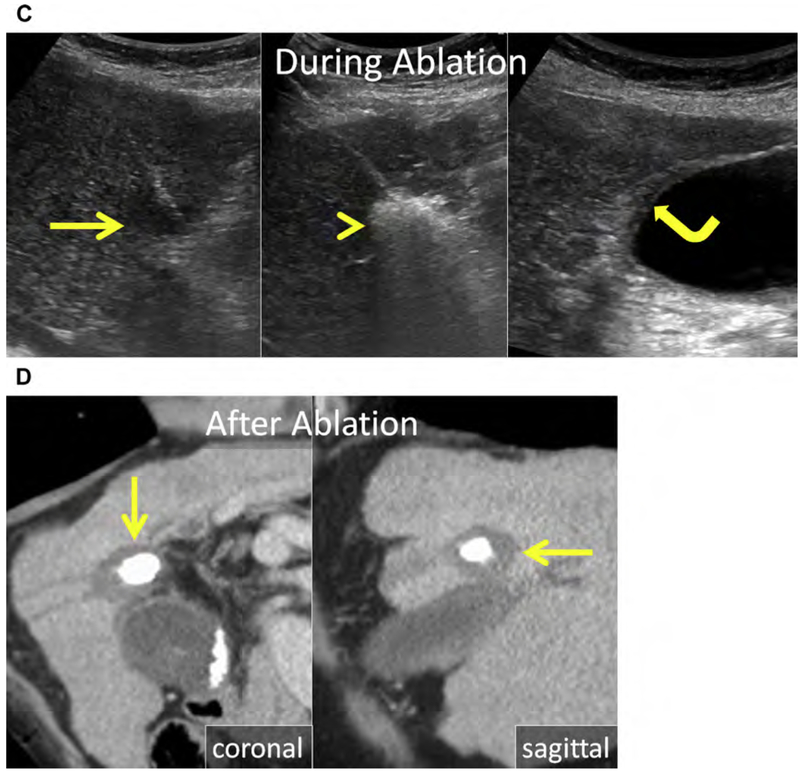
Fig. 14.
(A) Enhanced CT in the late arterial and portal venous phase shows a large (>3 cm) HCC in the medial left liver in proximity to the gallbladder (arrow). (B) The HCC was treated with TACE (arrow) because of the size and location. Ablation was initially deferred; however, at serial follow-up CT, LTP became apparent (arrowheads). (C) US during MW antenna placement and ablation. The hypoechoic HCC (arrow) becomes encompassed by the gas cloud formed during MW ablation (arrowhead). Minimal wall thickening of the gallbladder is the result of thermal injury to the serosa (curved arrow). (D) Enhanced coronal and sagittal CT immediately after MW ablation. The ablation encompasses the index ethiodized oil-laden lesion including a 5-mm margin (arrow). On follow-up images, there was no permanent damage to the gallbladder.


