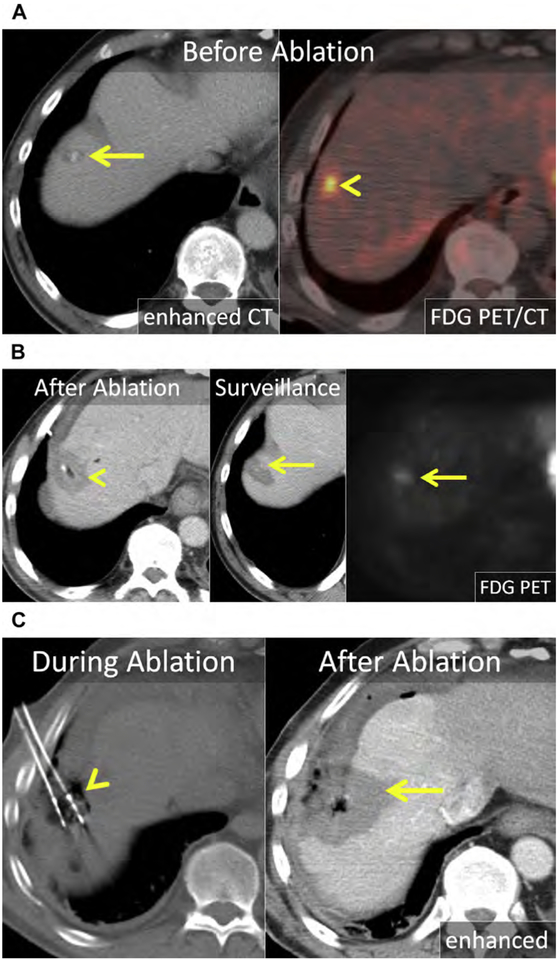
Fig. 16.
(A) Enhanced CT shows a 1.2-cm CRLM in the right liver, near the dome (arrow). The mass is metabolically active on fused 18F-fluorodeoxyglucose (FDG) PET-CT (arrowhead). (B) Enhanced CT immediately following MW ablation. The 2.5-cm ablation encompasses the index lesion (arrowhead); however, it does not achieve the 1-cm margin needed to mitigate the risk of LTP. At surveillance enhanced CT and FDG PET-CT, there was LTP (arrows). (C) On unenhanced CT, 2 MW antennas are positioned within the index lesion with gas surrounding the antennas (arrowhead). Artificial ascites was infused before and during MW ablation. Enhanced CT immediately following MW ablation shows a 4.5-cm ablation (arrow) covering the prior ablation and a 10-mm margin.

