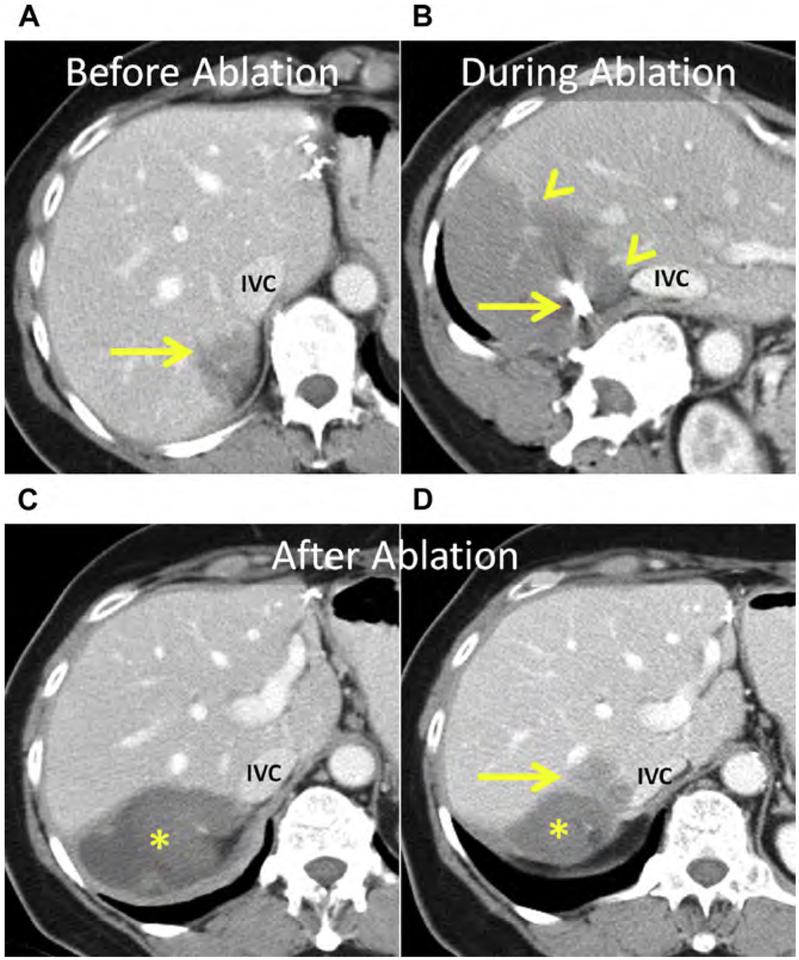
Fig. 2.
(A) Enhanced CT shows a CRLM in the medial right liver in proximity to the inferior vena cava (IVC) (arrow). (B) Enhanced CT after placement of RF electrodes (arrow). Segmental hypoenhancement of the dorsal right liver corresponds with the ablation and a hepatic infract (arrowheads). The ablation extends to the margin of the IVC and appears to encompass the index lesion. (C, D) Serial follow-up enhanced CT shows the index ablation (asterisk). (D) The new mass adjacent to the index ablation, in proximity to the IVC (arrow), represents LTP, the result of perfusion-mediated tissue cooling.

