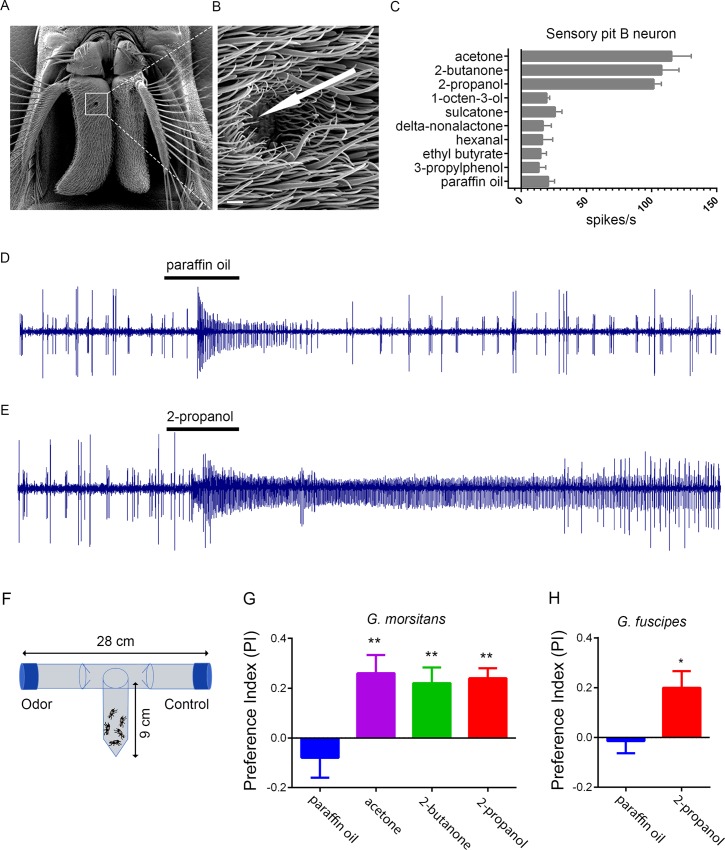
Fig 10. Responses of tsetse to acetone, 2-butanone, and 2-propanol.
A) Scanning electron micrograph of the G. morsitans antenna. The white square is centered on the opening of the sensory pit. B) Magnified image of the opening to the sensory pit. The arrow indicates the approximate position of a recording electrode, which is inserted through the opening of the sensory pit in order to pierce a basiconic Type II sensillum for electrophysiological recording. Scale bar is 5 μm. (C) Odorant response profile of sensory pit B neurons. Odorants were diluted 10−2 in paraffin oil. n≥5 for all stimuli tested. (D,E) Sample traces from sensory pit sensilla in response to paraffin oil diluent (D) and 2-propanol (E) presented for 0.5 seconds (black bars). The B neuron, represented by the smaller spikes, shows a weak response to paraffin oil, a response that is also observed in some Drosophila neurons [46], and a strong response to 2-propanol. The A neuron, represented by large spikes, may be inhibited by 2-propanol. (F) The T-maze paradigm. (G) Behavioral responses of G. morsitans. Means were compared using one-way ANOVA, followed by Tukey’s test for pairwise comparison against paraffin oil for all odorants. **, p<0.01. n = 10 replicates for all odorants; n = 5 for the paraffin oil diluent. (H) Responses of G. fuscipes. t-test; p<0.05. n = 14 replicates.

