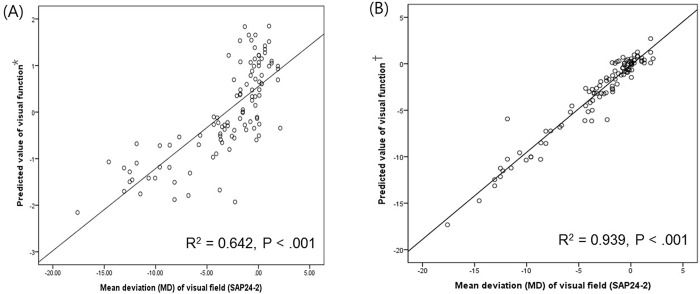
Fig 4. Scatterplots illustrating the linear correlation between standard automated perimetry (SAP) mean deviation (MD) value (dB) and predicted value of visual function.
(A) Correlation between MD value of SAP and the predicted value of visual function using peripapillary RNFL thickness (R2 = 0.642, P < .001). (B) Correlation between MD value of SAP and the predicted value of visual function using 4 variables including PPA area, peripapillary RNFL thickness, disc-foveal angel, and disc torsion degree(R2 = 0.939, P < .001). *Predicted value of visual function was calculated using peripapillary RNFL thickness. †Predicted value of visual function was calculated using PPA area, peripapillary RNFL thickness, disc-foveal angel, and disc torsion degree.

