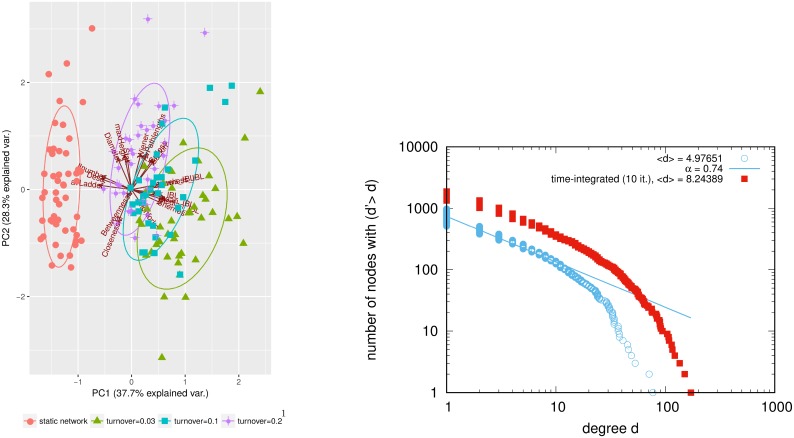
Fig 4. Comparison static vs. dynamic network.
Left: PCA plot of tree features for trees from time-integrated and dynamic skewed-clustered networks (β = 0.1), mean degree 〈n〉 = 5, number of nodes N = 1000. red: time-integrated network. Right: counter-cumulative degree distribution on log-log scale of time-integrated and dynamic network.

