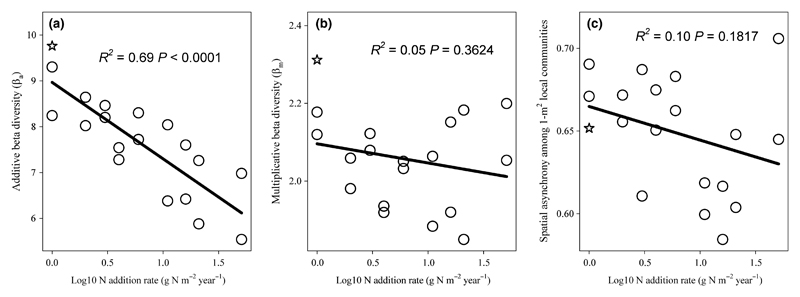
Figure 2.
Effects of N enrichment on beta diversity and variability. (a) N addition significantly reduced additive beta diversity (βa), but not (b) multiplicative beta diversity (βm) or (c) beta variability (i.e. spatial asynchrony among local communities). The value of each of the two points at each N addition level is the average of beta diversity at each N addition frequency. The open star symbol indicates data from the control.

