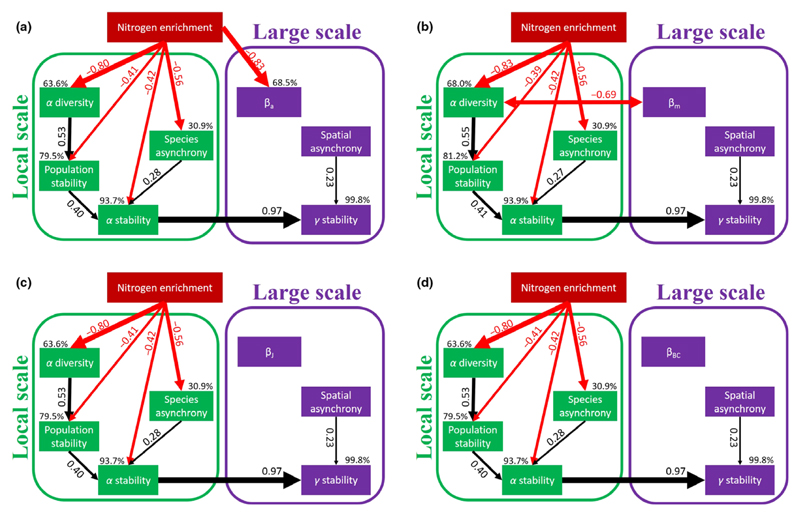
Figure 4.
The results of the final structural equation modelling (SEM) showing the pathways through which nitrogen enrichment influences gamma stability. The final SEM, (a) based on the additive beta diversity (βa) (χ2 = 13.534, P = 0.759; root mean square error of approximation (RMSEA) = 0.000; the Akaike Information Criteria (AIC) = 49.534), (b) based on the multiplicative beta diversity (βm) (χ2 = 14.526, P = 0.694; RMSEA = 0.000; AIC = 50.526), (c) based on the presence/absence-based index (Jaccard dissimilarity, βJ) (χ2 = 13.998, P = 0.784; RMSEA = 0.000; AIC = 47.998) and (d) based on the abundance-based beta dissimilarity (Bray-Curtis dissimilarity index, βBC) (χ2 = 15.889, P = 0.665; RMSEA = 0.000; AIC = 49.889). Note that RMSEA = 0.000 indicates a perfectly specified model constrained by the fact that alpha stability and spatial asynchrony completely determine gamma stability. Black and red arrows indicate significant (i.e. P < 0.05) positive and negative pathways respectively. Numbers adjacent to the arrows are standardised path coefficients, and the width of the arrows indicates the strength of the relationship. Percentages next to endogenous variables indicate the variance explained by the model (R2).

