Figure 5.
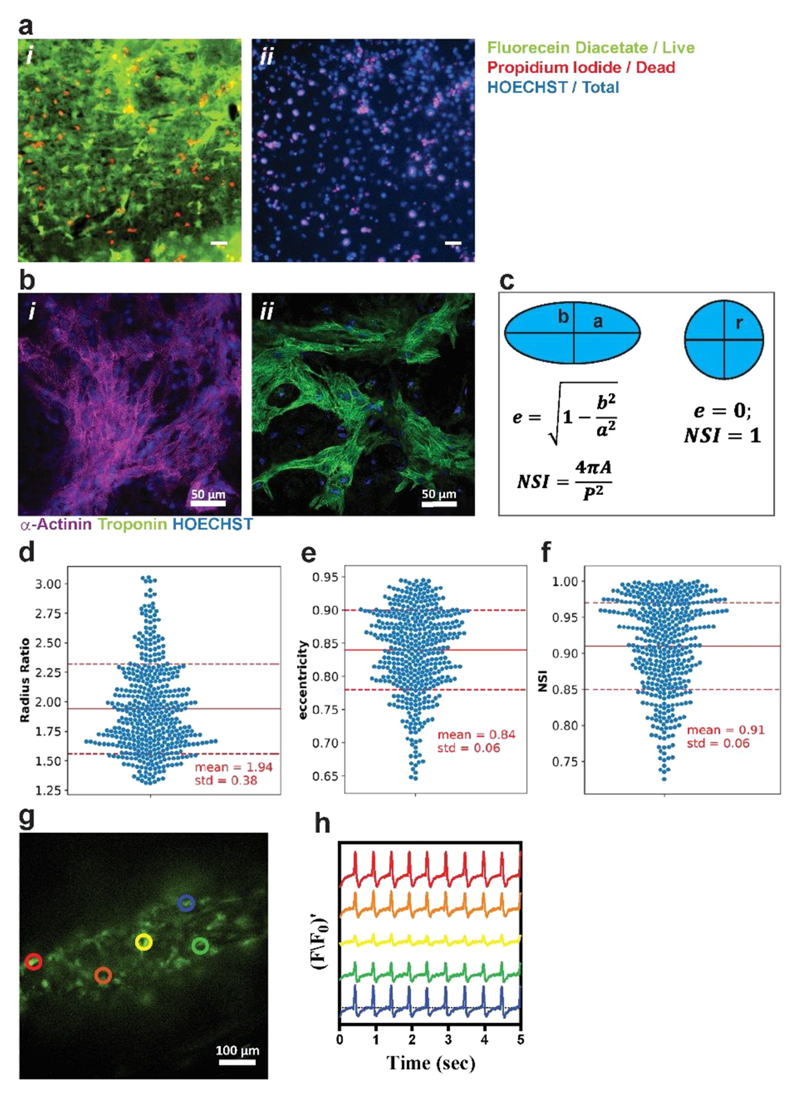
Cardiac cell culture and function. (a) Cardiomyocyte viability by Live/Dead assay. (i) Live cells stained with fluorecein diacetate (green) and dead cell nuclei stained with PI (red). (ii) Hoechst (blue) and PI staining were used for quantifying viability. % Viability was quantified as the ratio of PI-negative nuclei to total nuclei count. % viability was 0.69 ± 0.013 as measured from two different samples, with 4 FOVs each. Scale bar, 50 μm. (b) Cardiac cell staining for alpha actinin (i, purple) and troponin-t (ii, green); nuclei are Hoechst-stained (blue). (c) Nuclear stains were used to quantify nuclear morphology. Eccentricity, e, and nuclear shape index, NSI, were defined in order to assess whether nuclei were round or elliptical. Radius aspect ratio (d), eccentricity (e), and NSI (f) were calculated for nuclei from 8 images from two different samples. (g) Calcium transient was assessed at specified points by monitoring calcium dye fluorescence. (h) Synchronized calcium signals were observed at all points. F/F0 refers to measured fluorescence normalized to maximum fluorescence. The colors are correlated to the colored circles in (g).

