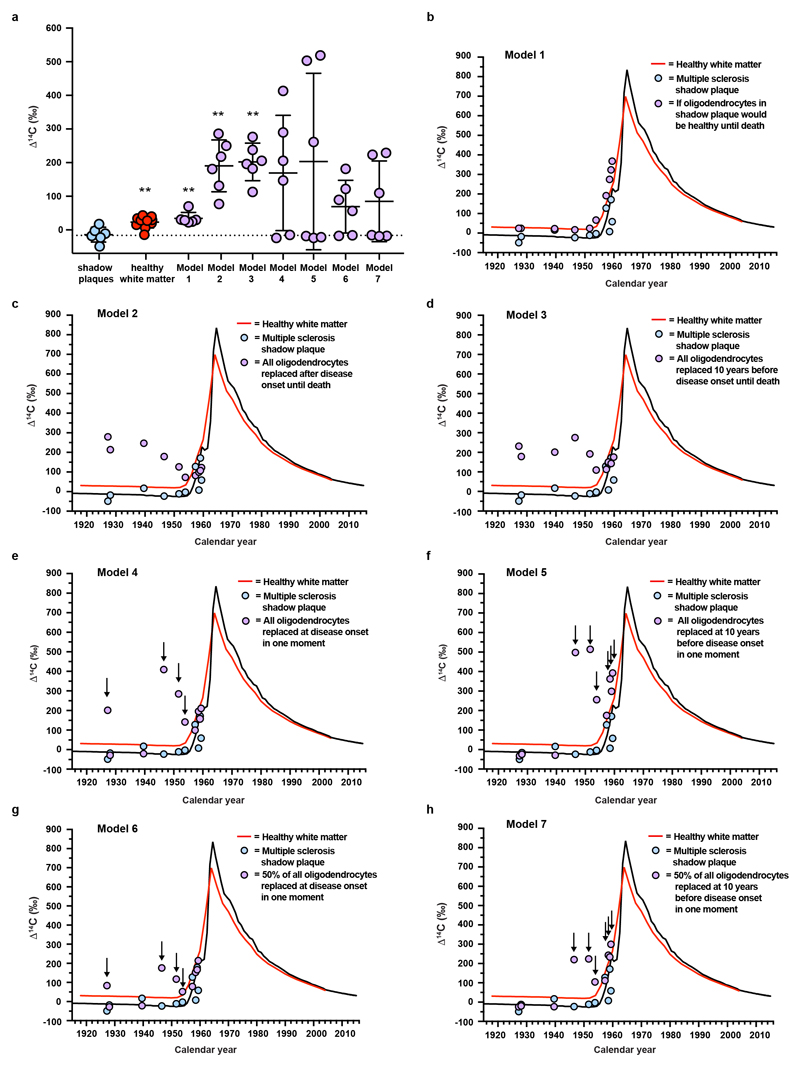
Extended Data Figure 8. Modeled 14C concentration in DNA of oligodendrocytes generated from oligodendrocyte progenitor cells in shadow plaques.
a, Measured and modelled data. The level of atmospheric 14C prior to 1955 are indicated by the dotted line. Mean (long line) ± s.d (short lines). Statistical analyses represent comparison between shadow plaque data (n=6) and the other groups. b-h Measured and modelled data plotted in relation to time and atmospheric 14C concentration.
Model 1: Estimated 14C concentration in mature oligodendrocytes (OLs) in shadow plaques if assumed to have healthy turnover rate until death of the patients, is similar to healthy white matter OLs and is significantly higher compared to measured mature OLs in shadow plaques (**, P=0.002, two-tailed Mann-Whitney test, **, P=0.0047, two-tailed Mann-Whitney test, n = 6 and 6). Model 2 and 3: To reconstitute the observed mature OL density with newly made OLs, it would require oligodendrocyte progenitor cells (OPCs) to divide at least 4 times. If this would occur over the time from onset of the disease (model 2) or even from 10 years before the first clinical symptoms (model 3) until death of the patient, it results in significantly higher modeled 14C concentrations in mature OL in shadow plaques than measured (model 2, **, P=0.002, two-tailed Mann-Whitney test, n = 6, model 3, **, P=0.002, two-tailed Mann-Whitney test, n = 6). Model 4 and 5: Even with more conservative scenarios assuming all replacement happening not throughout the disease course, but early by proliferation of OPCs at disease onset or before, still results in higher 14C concentrations in some patients. Model 6, 7: Modeled data as above, but with 50% of OLs being newly made from OPCs and 50% being old OLs. For some patients, the time of disease onset and 10 years before onset occur before the rise of the 14C atmospheric levels (1955). For these patients, any cell replacement by proliferation of old OPC during this period would results in values similar to atmospherical levels. Arrows points to patients with time periods prior to and disease onsets which overlap with very highly elevated atmospheric 14C levels compared to respective levels at time of birth of the patients, and that the modeled values deviate from the measured rules out these scenarios. The red line depicts genomic DNA 14C concentrations in oligodendrocytes from healthy subjects. Healthy white matter (a) **, P=0.0047, two-tailed Mann-Whitney test, (n=10). **, P<0.01. See also Supplementary Table 1, 11 and 12.

