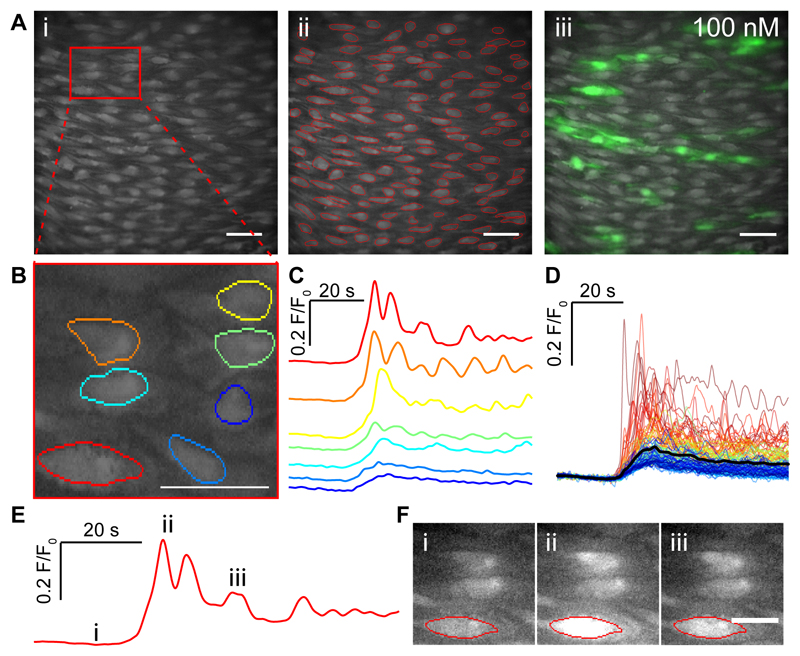
Fig. 1. CCh evoked Ca2+ signals in the endothelium of intact arteries.
(A) Ai Representative image frame showing ~200 endothelial cells from an imaging field. (Aii) An image of cells with automatically identified regions of interest (ROI) superimposed onto the imaging field of view. (Aiii) Ca2+ images illustrating the endothelial response during treatment with CCh (100nM) overlaid on a basal Ca2+ image. (B) Expanded view of the endothelium from the area highlighted in the red box in (A). (C) Baseline-corrected Ca2+ signals (F/F0) obtained from the fluorescence within the ROI shown in (B). The color for each trace matches that presented in the ROI in B. The fluorescence amplitudes are scaled in the same way for each cell. (D) Overlaid Ca2+ signals from all individual cells identified in Aii. The black line shows the mean response (E) An example single endothelial cell Ca2+ signal and the corresponding images shown in F with time-points indicated by the roman numerals (E,F). Scale bars, 50μm.

