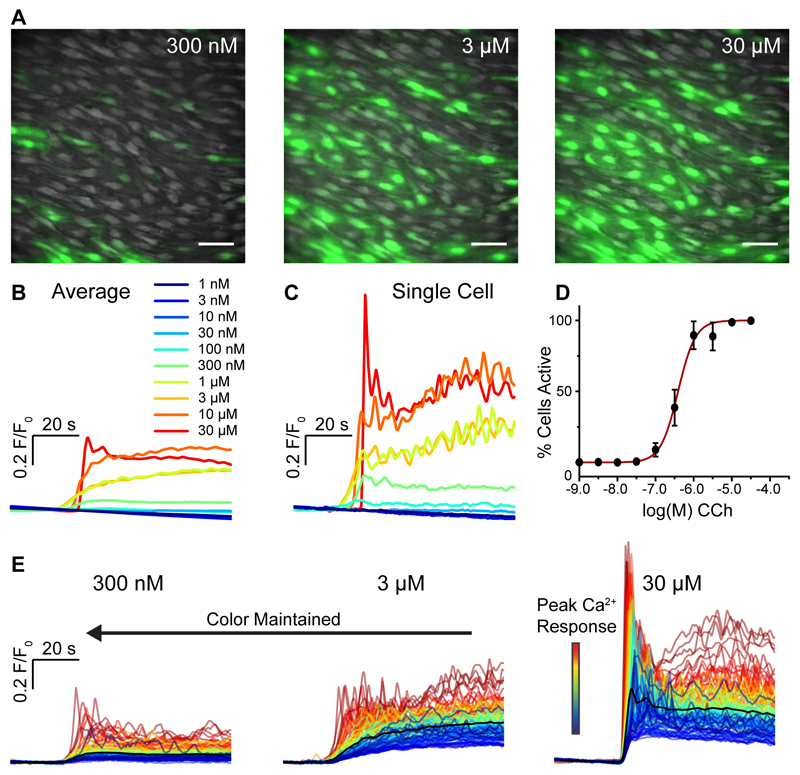
Fig. 2. Concentration-dependence of CCh-evoked endothelial Ca2+ signaling.
(A) Representative composite images of endothelial Ca2+ activity in response to increasing concentrations of CCh. The three images show illustrative data from a single artery in which the endothelium was stimulated with consecutively increasing concentrations of CCh. The full series applied in each experiment was 10 increments from 1 nM to 30 μM. Scale bars, 50μm. (B) Average Ca2+ (F/F0) responses from all cells for each concentration of the full series. The individual traces are color-coded based on the concentration of CCh applied. (C) Ca2+ traces from a single cell. The color code is the same as shown in B. (D) Percentage of cells activated by increasing concentrations of CCh. The x-axis is log10 of the CCh concentration. (E) Ca2+ traces from all 129 individual cells from the datasets shown in A. The black line is the mean response. The other colors assigned to each trace is based on the amplitude of the initial response to CCh in each cell at the highest CCh concentration (right-most dataset), i.e. if a cell’s trace is colored blue in one set of traces, the same trace in the other two data sets is also colored blue. The color of each specific cell’s trace is maintained throughout subsequent additions of agonist allowing for a direct comparison of the same cells between responses.

