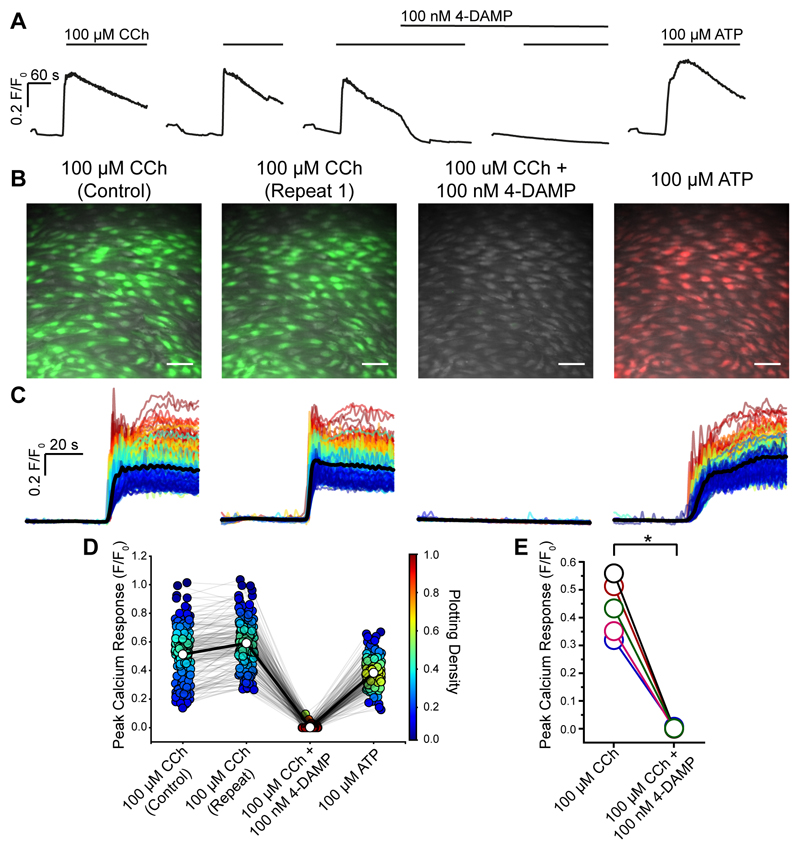
Fig. 3. CCh activates M3 receptors in the endothelium.
(A) Representative experiment (average of all cells) showing the effect of the selective M3 antagonist 4-DAMP (100 nM). The endothelium was activated by CCh at a concentration (100 μM) evoking a maximum response. Two control responses show approximately reproducible responses. CCh application is indicated by the line above the traces. 4-DAMP inhibits the response. After block of M3 receptors, the cells remain viable and respond to ATP (100 μM; right-hand trace). (B) Composite Ca2+ images showing the cells that respond to CCh (100 μM; green) and an absence of response after the block of M3 receptors by 4-DAMP (100 nM). The subsequent application of ATP (100 μM) evoked a response (red). All images are from the same field of endothelium. (C) Ca2+ signals from all activated cells in B, 30s baseline and 60s activation. Responses are overlaid and the black line is the average. (D) Paired peak Ca2+ (F/F0) responses from each individual cells (circles) matched for each treatment (grey line) from a single experiment. Average response indicated by white circle and matched across each treatment by bold line. The Plotting Density (right axis) indicates the distribution of Peak F/F0 values (red high, blue low occurrence of the same value). (E) Paired summary data illustrating changes in Peak F/F0 response values averaged across all cells (n=5). Scale bars, 50μm. p < 0.05

