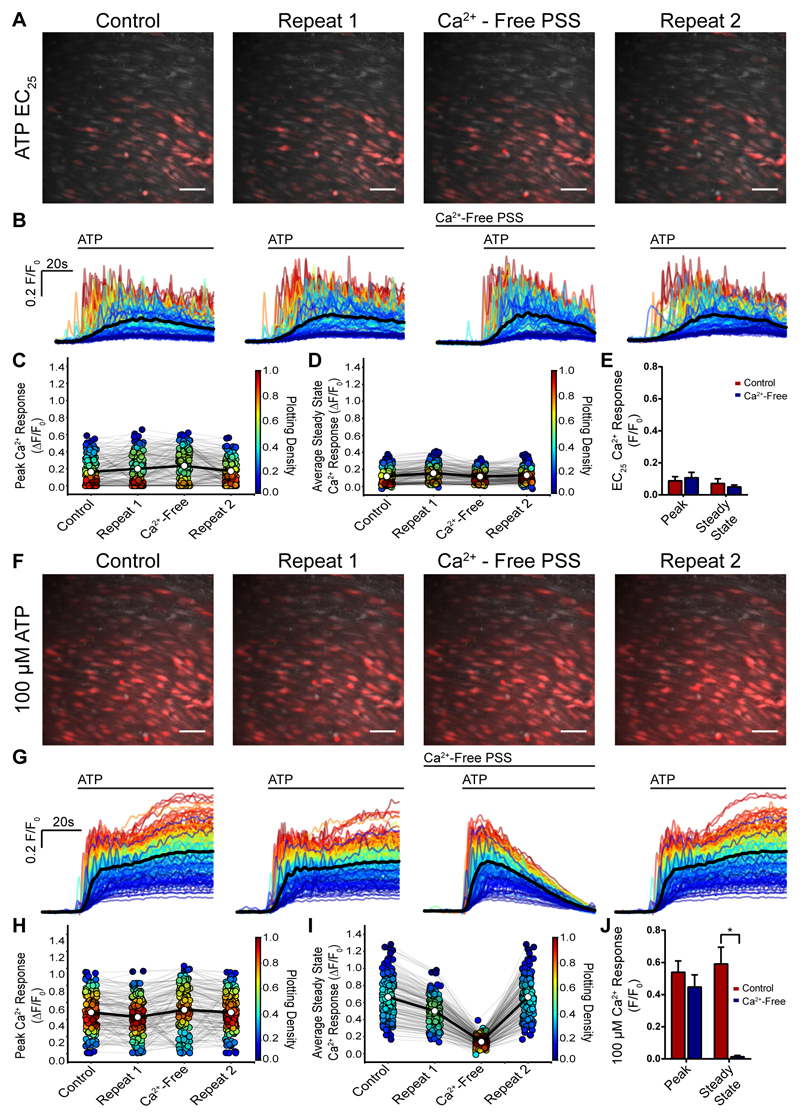
Fig. 5. The initial response to ATP persists in a Ca2+ free bath solution.
(A) Composite Ca2+ images showing the cells that respond to ATP (EC25; red) were reproducible and the response persisted when extracellular Ca2+ was removed. Two control responses (A, left panels; control and repeat 1) were followed by activation by ATP (EC25) after a 7 minute period in a Ca2+ free bath solution. In the Ca2+ free bath, the response to ATP was largely unaltered. In the final part of the experiment (repeat 2) Ca2+ was restored to the bathing solution and once again a similar response occurred. All images are from the same field of endothelium. (B) Ca2+ signals from the activated cells in A, 30s baseline and 60s ATP activation. All traces from individual cells are overlaid and the black line is the average. Time of activation is shown above the trace. (C) Peak Ca2+ (F/F0) response from each individual cells (circle) matched for each treatment (grey line) from a single experiment. Average response indicated by white circle and matched across each treatment by bold line. The Plotting Density (right axis) indicates the distribution of Peak F/F0 values. (D) Late (steady-state) (F/F0) response measured at 45 s in controls, after removal of external Ca2+ and after the return of extracellular Ca2+. (E) Average peak and steady state responses to ATP (EC25) in control (red) and after removal of external Ca2+ (blue); (n=5, p>0.05). (F) Composite Ca2+ images showing the cells that respond ATP (EC75; red) concentration which also was reproducible and the initial response persisted when extracellular Ca2+ was removed. Two control responses (A, left panels; control and repeat 1) were followed by activation by ATP (EC75) after a 7 minute period in a Ca2+ free bath solution. In the Ca2+ free bath, the response to ATP was largely unaltered. In the final part of the experiment Ca2+ was restored to the bathing solution and once again a similar response occurred. All images are from the same field of endothelium. (G) Ca2+ signals from the activated cells in F, 30s baseline and 60s ATP activation. All traces from individual cells are overlaid and the black line is the average. Time of activation is shown above the trace. (H) Peak Ca2+ (F/F0) response from each individual cells (circle) matched for each treatment (grey line) from a single experiment. Average response indicated by white circle and matched across each treatment by bold line. The Plotting Density (right axis) indicates the distribution of Peak F/F0 values. (I) Late (steady-state) (F/F0) response measured at 45 s in controls, after removal of external Ca2+ and after the return of extracellular Ca2+. (J) Average peak and steady state responses to ATP (EC25) in control (red) and after removal of external Ca2+ (blue); (n=5, p>0.05 for the peak response; p<0.05 for the late response). Scale bars, 50 μm.

