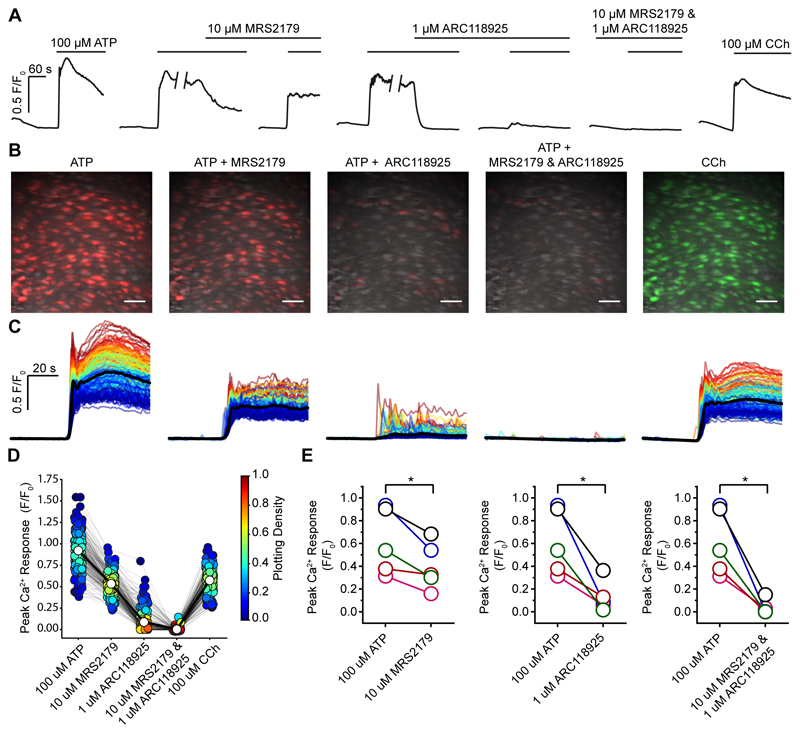
Fig. 6. ATP activates P2Y2 receptors in the endothelium.
(A) Representative experiment showing the effect of the P2Y1 antagonist MRS2179 (10 μM) and P2Y2 antagonist ARC118925 (1 μM) on the maximal response to ATP (100 μM). The traces show the average responses from all cells in the field. The P2Y1 antagonists (MRS2179, 10 μM) had only a small effect on the response. The responses are almost fully blocked by the P2Y2 receptor blocker (ARC118925; 1 μM). The small residual response is inhibited by the P2Y1 antagonist. At the end of the experiment CCh (100 μM) was applied to confirm cell viability. (B) Composite Ca2+ images showing the cells that respond to ATP (100 μM) in presence of MRS2179 or ARC118925 (red) or both. The right panel shows the cells that response to CCh (100 μM; green) at the end of the experiment. All images are from the same field of endothelium. (C) Ca2+ signals from the activated cells in B, 30s baseline and 60s activation are shown. (D) Peak Ca2+ (F/F0) response from each individual cell (circle) matched for each treatment (grey line) from a single experiment. Average response indicated by white circle and matched across each treatment by bold line. The Plotting Density (right-hand axis) indicates the distribution of Peak F/F0 values (red high, blue low occurrence of the same values). (E) Paired summary data illustrating changes in Peak F/F0 response values averaged across all cells. Each color represents a different animal and is maintained across the different treatments (n=5). Scale bars, 50μm. p < 0.05.

