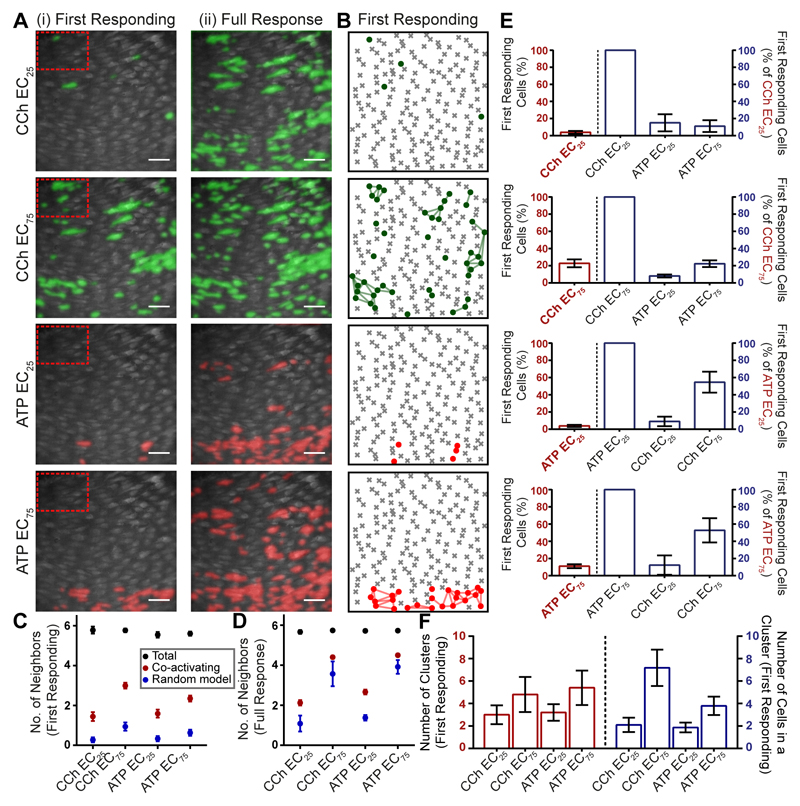
Fig. 7. Agonists activate spatially-distinct clusters of cells.
(A) Representative composite images of Ca2+ activity in the endothelium in response to the EC25 and EC75 concentrations of CCh and ATP in a single artery. The first responding (initial 4s; Ai) and total number of cells (Aii) activated by the EC25 and EC75 of CCh and ATP are shown. Images are scaled to show all activated cells. (B) The number of activated cells and their spatial relationships were calculated from Voronoi neighor analysis and presented as ‘Star maps’. The plot shows the cells in the first 4s of activation (dots and lines) by CCh and ATP from the total population of cells (grey crosses and cell outlines). The star map shows the same data presented in A (first responding). (C,D) plots the number of neighboring cells activated by the EC25 and EC75 of ATP and CCh in the first 4 s (C) and total cells activated over the entire data set (D). The total number of neighbors was determined for each cell from the Voronoi neighbor analysis (6; black circles) and number of these activated for each of the conditions (red circles) is significantly greater (p<0.05) from that predicted from a random model of activated cells (blue circles). The expectation of the number of neighbors activated randomly was determined as the (mean number of neighbours) * (activating fraction) for each agonist. (E) Number of cells activated at the concentration shown on the x-axis as a percentage of the total population of cells in the field (red and left). “First responding cells” are the cells activated within the first 4s. The right side of each plot (E; blue) shows the percentage of precisely the same cells that are activated by each of the conditions shown. The plot shows that those cells that are most sensitive to one agonist are much less sensitive to the other. (F) The number of clusters and number of cells in a cluster increase at the EC75 when compared to the EC25 of CCh and ATP. Scale bars, 50μm.

