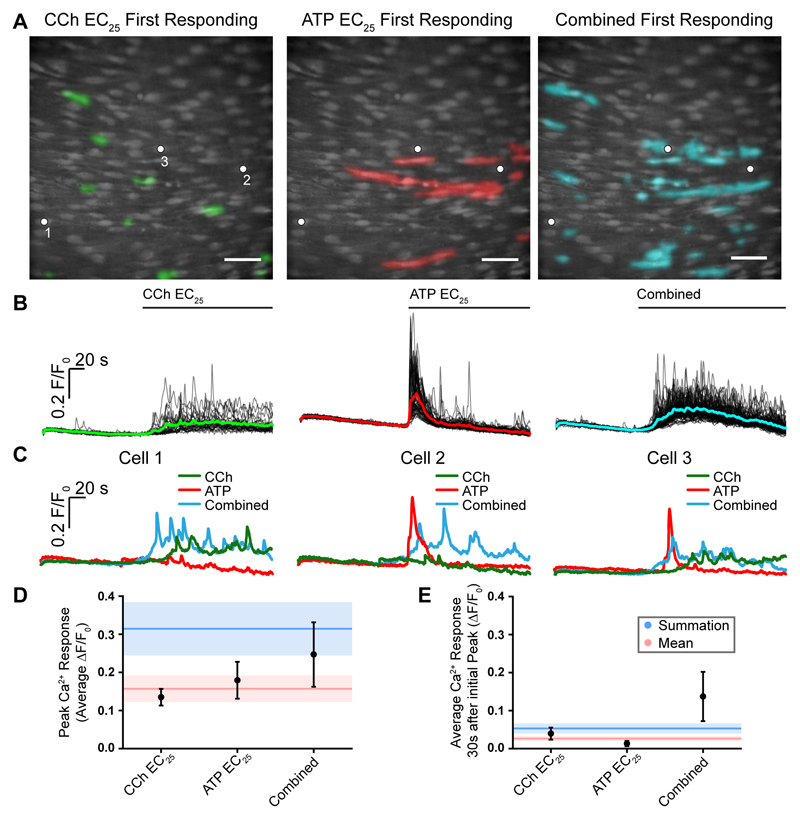
Fig. 9. Signal integration and parallel processing.
(A) Composite Ca2+ images showing cells that respond in the first 4 seconds of activation by the EC25 concentrations of CCh (left, green) and ATP (middle, red). Images are of the same field of endothelium. The right-panel shows cells activated (cyan) in the same field of endothelium when both drugs were applied together. (B) Ca2+ responses from all activate cells in the field of endothelium shown in A. The Ca2+ increase evoked by CCh was on average a slow increase that remained elevated with oscillations (left green). The response to ATP on average was a sharp transient increase that declined towards resting values (red middle). When both agonist were applied (combined; blue right) the Ca2+ increase appeared to have features of each agonist i.e. a slow but larger initial increase than with CCh, which remained more elevated than ATP and slowly declined. Agonists were present for the duration indicated by the line above each trace. (C) Examples of responses from 3 separate cells to CCh, ATP and to the two agonists when applied together. In each panel in C, traces are from the cells indicated by the white dots in the panels in A. It is the same 3 cells in each case. Cell 1 is shown in the left panel in C, cell 2 in the middle panel and cell 3 in the right panel. Cell 1 (left panel) responds to CCh but not to ATP. The characteristics of the response in Cell 1 is altered when both ATP and CCh are present (combined) with a faster and larger upstroke. Cell 2 responds to ATP but not CCh. Once again the characteristics of the response in Cell 2 is altered when both ATP and CCh are present (combined) with a more sustained later Ca2+ change. Cell 3 responds to each agonist (CCh and to ATP). Once again the characteristics of the response in Cell 3 is altered when both ATP and CCh are present (combined). (D) Mean peak responses (black circles) to the EC25 of CCh and ATP separately and when both were present together (combined). The red line shows the calculated mean of peak response when both agonists were added separately. The red shaded region shows the standard error of the mean. The blue line shows the sum of the peak responses when both agonists were added separately. The blue shaded region shows the standard error of the mean. The combined peak response exceeded the mean and was less than the summed response. (D) Mean steady-state responses (black circles) to the EC25 of CCh and ATP separately and when both were present together (combined). The red line shows the calculated mean of the steady-state response when both agonists were added separately. The red shaded region shows the standard error of the mean. The blue line shows the sum of the steady-state responses when both agonists were added separately. The blue shaded region shows the standard error of the mean. The combined steady-state response exceeded both the mean and the summed response. Scale bars, 50μm.

