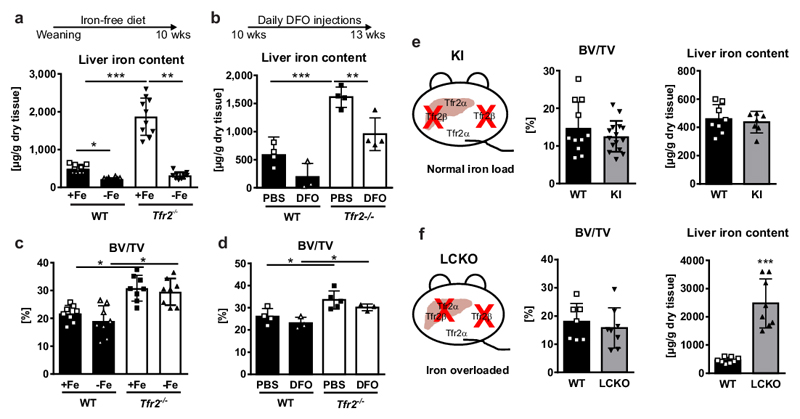
Figure 2. High bone mass in Tfr2-/- mice is independent of iron overload and the hepatic function of Tfr2.
(a, c) Male WT and Tfr2-/- mice received a purified diet without iron (-Fe) starting from weaning until the age of 10 weeks. Control mice received a standard diet with 0.2 g iron/kg food (+Fe). (a) Liver iron content was determined on dried tissue using photometry. (mean ±SD; n=10 per group). (c) Bone volume/total volume (BV/TV) was assessed using µCT. (mean±SD; WT +Fe n=9; WT –Fe, Tfr2-/- +Fe and Tfr2-/- -Fe, n=8 per group). (b, d) Ten-week-old female WT and Tfr2-/- mice received daily i.p injections of 250 mg/kg deferoxamine (DFO) or PBS for three weeks. At 13 weeks of age, mice were sacrificed to measure (b) iron liver content and (d) BV/TV. (n=3-5 per group). (a-d) Two-way ANOVA with Bonferroni post-hoc test was used for statistical analysis. (e) Schematic representation of Tfr2 knock-in (KI) mice, which lack the Tfr2β isoform. BV/TV and iron liver content of 10-week-old male Tfr2 KI mice and control mice. (BV/TV, WT n=11, KI n=15; Liver iron, WT n=8, KI n=7). (f) Schematic representation of the Tfr2 setup of liver-specific Tfr2α knock-out (LCKO) mice on a Tfr2 KI background. BV/TV and liver iron content of 10-week-old male LCKO and WT mice. (n=8 per group). (e,f) A two-tailed t-test was used for statistical analysis. All data are presented as mean±SD. *p<0.05; **p<0.01; ***p<0.001.

