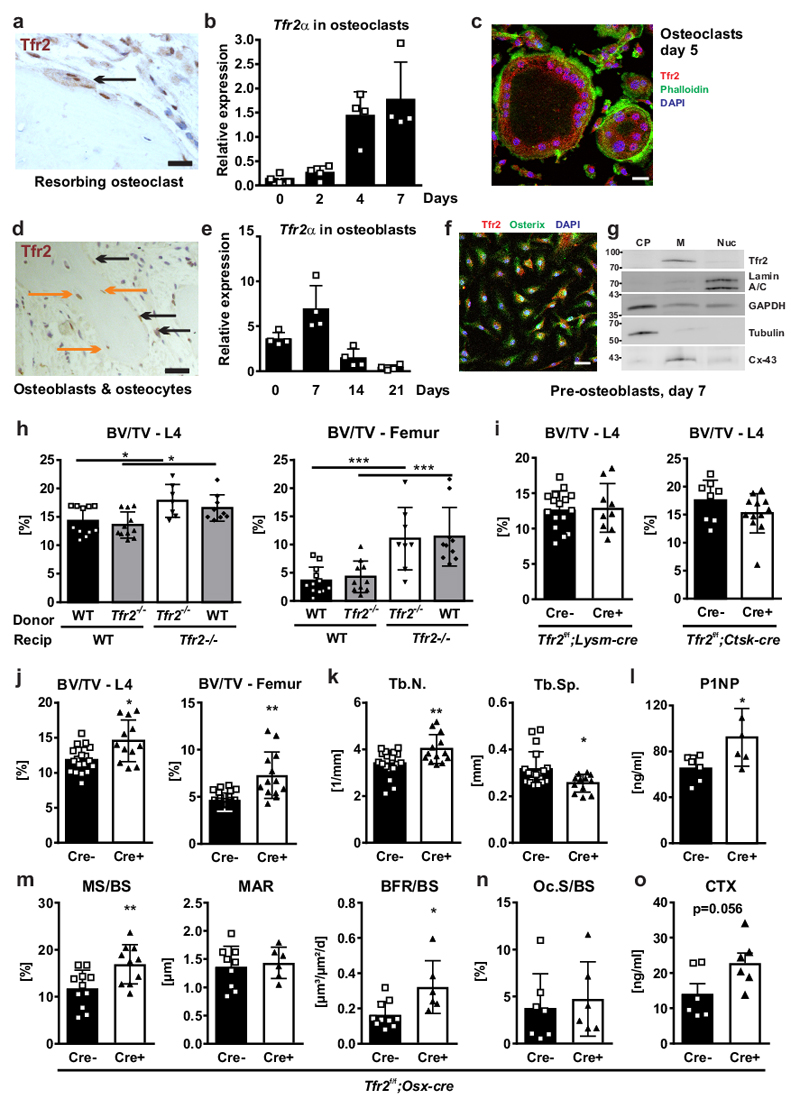
Figure 3. Deficiency of Tfr2 in osteogenic cells increases bone mass.
(a, d) Immunohistochemical analysis of Tfr2 on vertebral bone of WT mice. One representative image is shown out of three. Arrows indicate Tfr2 expression in multinucleated osteoclasts and osteoblasts/osteocytes (osteoblasts: black arrows; osteocytes: orange arrows). Scale bar: 20 µm. (b, e) Tfr2α mRNA expression during osteoclast (b) and osteoblast (e) differentiation of WT cells (n=4). (c, f) Immunofluorescence staining for Tfr2 in mature osteoclasts (c) and immature osteoblasts (f). Scale bar: 20 µm. These staining were repeated twice with similar results. (g) Subcellular fractioning of day 7 osteoblast protein lysates from WT mice. One representative blot is shown out of three. CP: cytoplasm; M: membrane; Nuc: nuclear fraction. Cx-43: connexin-43. (h) Bone marrow was transplanted from 12-week-old male WT or Tfr2-/- mice into lethally irradiated 9-week-old male WT and Tfr2-/- recipient (recip) mice. After 16 weeks, the bone volume/total volume (BV/TV) was measured using µCT. (L4, WT-WT n=11, Tfr2-/--WT n=11, Tfr2-/--Tfr2-/- n=7, WT-Tfr2-/- n=9; Femur, WT-WT n=12, Tfr2-/--WT n=10, Tfr2-/--Tfr2-/- n=8, WT-Tfr2-/- n=10). Two-way ANOVA with Bonferroni post-hoc test was used for statistical analysis. (i) BV/TV of the fourth lumbar vertebrae of 10-week-old male cre-positive and cre-negative Tfr2f/f;Lysm-Cre and Tfr2f/f;Ctsk-Cre mice. (Tfr2f/f; Lysm-cre, Cre- n=16, Cre+ n= 9; Tfr2f/f; CtskCre, Cre- n=8, Cre+ n=12). (j-o) Bone analysis of 10-week-old male cre-positive and cre-negative littermate control Tfr2f/f;Osx-Cre mice. (j) BV/TV (L4, Cre- n=18, Cre+ n=12; Femur, Cre- n=18, Cre+ n=13). (k) Trabecular number (Tb.N) and trabecular separation (Tb.Sp) (Tb.N., Cre- n=18, Cre+ n=13; Tb.Sp., Cre- n=19, Cre+ n=12). (l) Serum levels of P1NP. (n=6 per group). (m) Mineralizing surface per bone surface (MS/BS), mineral apposition rate (MAR), and bone formation rate per bone surface (BFR/BS) determined at the lumbar spine. (MS/BS, Cre- n=11, Cre+ n=10; MAR, Cre- n=9, Cre+ n=6; BFR, Cre- n=10, Cre+ n=6). (n) Osteoclast surface per bone surface (Oc.S/BS) analyzed at the lumbar spine. (Cre- n=7, Cre+ n=6). (o) Serum CTX levels (n=6 per group). (i-o) A two-tailed t-test was used for statistical analysis. All data are presented as mean±SD. *p<0.05; **p<0.01; ***p<0.001.

