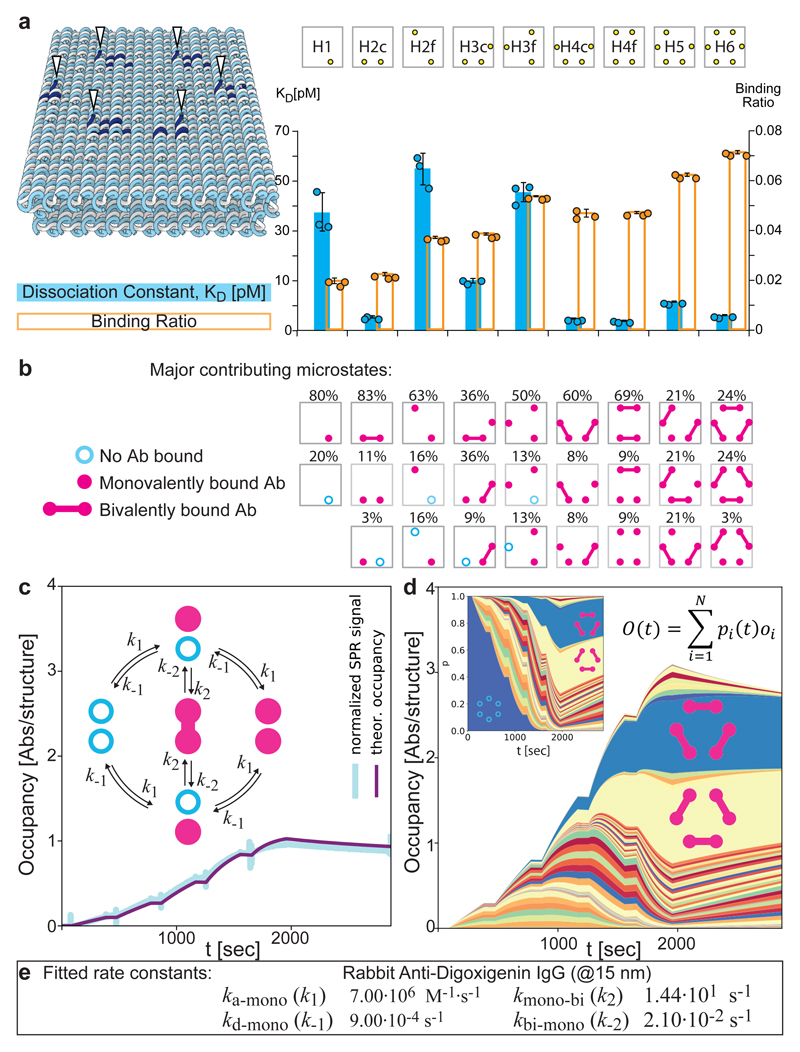
Fig. 4. Steady state and dynamic analyses of multivalent patterns reveals a binding profile stratified by competing states.
a Comparison of final measured binding ratio (orange secondary y axis) and apparent KD values (blue main y axis) determined for different nanopatterns (top row schematics, H-hexagon, #-no of antigens displayed, c-close, f-far) of digoxigenin on the brick structure (left) where antigens are displayed in a regular hexagon with edge distances of approximately 15 nm (Fig. 1, Supplementary Fig. 5) using rabbit IgG. (n=3; central values = average value; error bars = standard deviation) b Their corresponding most-dominant microstates determined by a model of steady state binding behaviour. c. example of SPR curve (cyan) for a partial hexamer configuration (H2c in a) and corresponding fitted model output (magenta). Inset shows schematic visualization of the network of states for this system and transitions between those states governed by the 4 rate parameters. d Weighted probability trajectory for the hexameric antigen pattern. Each state has a corresponding occupancy, which can be used to weight its probability according to its contribution to the SPR signal. The stacked summation of all weighted probabilities reproduces the SPR curve for that experiment. Equation describes total occupancy as the expectation value function of individual state occupancies. Inset shows the unweighted probability distribution of states including the empty state initial condition in blue. e Rate constants, including internal monovalent-bivalent kinetics determined by model fitting for rabbit IgG using data from binding to the brick patterns.

