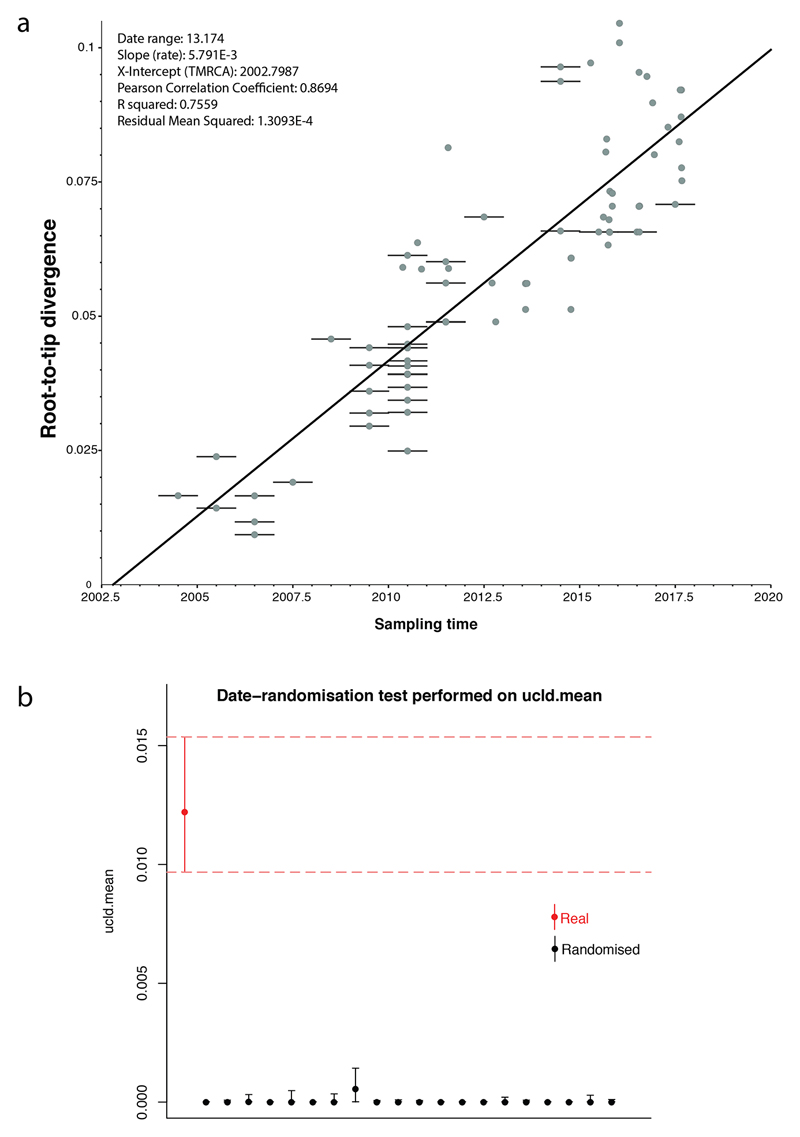
Extended data Figure 2.
Assessment of the temporal signal within the dataset. a, Linear regression of the root-to-tip distance against sampling time obtained with TempEst [29] using a maximum-likelihood phylogeny of 81 representative seventh pandemic V. cholerae O1 isolates (i.e., those used for the BEAST analysis). Bars on nodes indicate the precision of the isolation date (e.g., if only the year of isolation is known, the bar spans the entire year). b, Comparison of the ucld.mean parameter estimated from 20 date-randomisation BEAST experiments and the original dataset. The rate for the correctly dated tree is shown in red. The median and 95% Bayesian credible interval for the ucld.mean parameter are provided.

