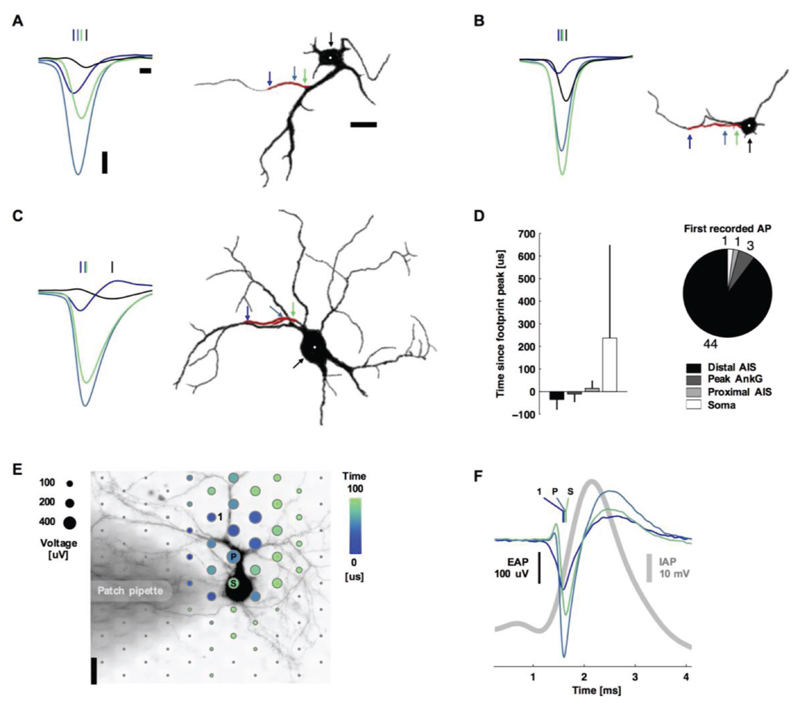
Figure 3. Action potentials typically initiated at the distal AIS.
A–C) Left: spontaneous action potentials at the distal AIS (blue), peak ankyrin-G fluorescence signal (blue-green), proximal AIS (green), and soma (black). Vertical lines indicate the timing of the negative voltage peak. Waveforms are the average of 11, 14, and 69 spikes for (A), (B), and (C). Right: silhouettes of immunostained neurons’ fluorescence images (black: MAP2, red: ankyrin-G). Colored arrows and the white dot indicate the location of the plotted waveforms. Scale bars: 100 μV vertical; 100 μs left; 20 μm right. D) Summary statistics. Bar plots are mean ± s.t.d., N = 49. E) Spatial and temporal (color) distribution of the averaged EAP (dot sizes). The shaded area is a patch pipette that evoked action potentials by current injection and delivered the fluorescent dye for live-cell imaging. The labeled electrodes and waveform colors correspond to those in (B): the 1st electrode recording an action potential (1), the electrode recording the Peak voltage signal (P), and the electrode nearest to the Soma (S). Scale bar: 20 μm. F) Average intracellular (gray) and extracellular (color) action potential waveforms (39 spikes). Colored vertical lines indicate the timing of the negative voltage peak.

