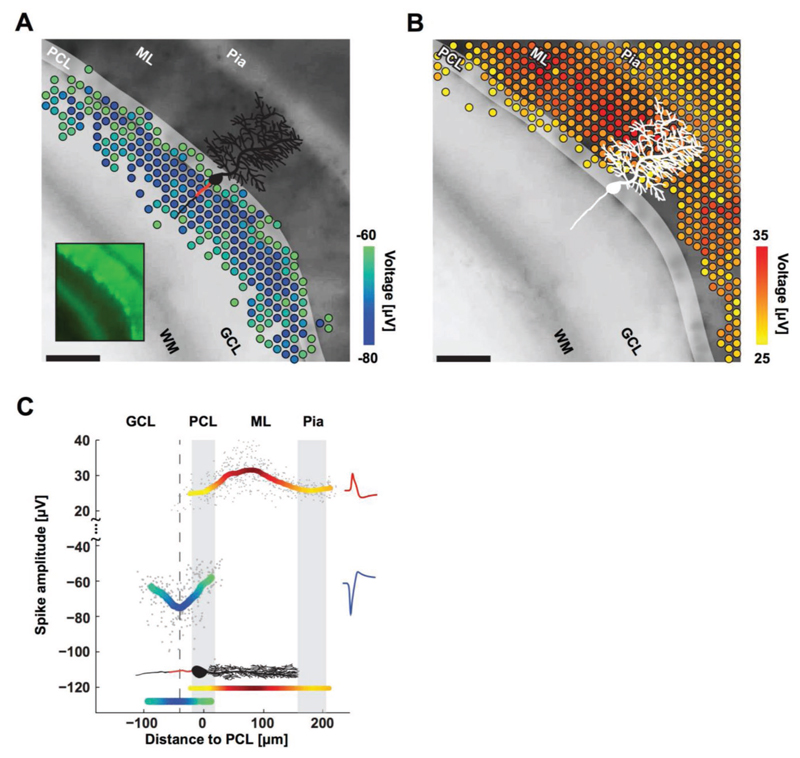
Figure 5. Purkinje cells’ negative and positive EAPs colocalize with AISs and dendrites.
A) Spatial distribution of the most negative EAPs recorded from an acute cerebellar slice. Dots show the locations of recording electrodes that detect EAPs (color) below a –60 μV threshold. EAP amplitudes are the mean voltage of the 20 largest events during a 10 s recording. The underlying black-and-white live-cell fluorescence image, taken immediately after recording, shows the location of the cerebellar layers: white matter (WM), granular cell layer (GCL), Purkinje cell layer (PCL), molecular layer (ML), and pia. The somas of the Purkinje cells are in the PCL (highlighted for clarity; easier to see in the smaller inset image). All Purkinje cell dendrites are in the ML, all AISs are in the GCL. The microscopy image captured cells at the top layer of the acute slice, while the EAPs were recorded from cells at the bottom layer. A sample cartoon of a Purkinje cell is shown in black with a red line estimating the AIS location. Scale bar: 100 μm. B) Distribution of the positive EAPs in analogy to A for EAPs above a 25 μV threshold. C) Summary of EAP amplitudes. Gray dots represent the largest negative or positive EAP amplitudes detected at each electrode versus the distance of the electrode from the PCL. Colored curves represent the mean for both negative (blue-green) and positive (yellow-red) EAPs as measured by the respective electrodes. The minimum in the curve representing the negative EAPs (dashed line at −40 μm) colocalizes with the putative location of AISs (red line in the cartoon of a Purkinje cell) in the GCL. The largest positive EAPs colocalize with the dendrites in the ML. Representative spike shapes of the negative (blue) and positive (red) EAPs, recorded from the acute cerebellar slice, are shown on the right.

