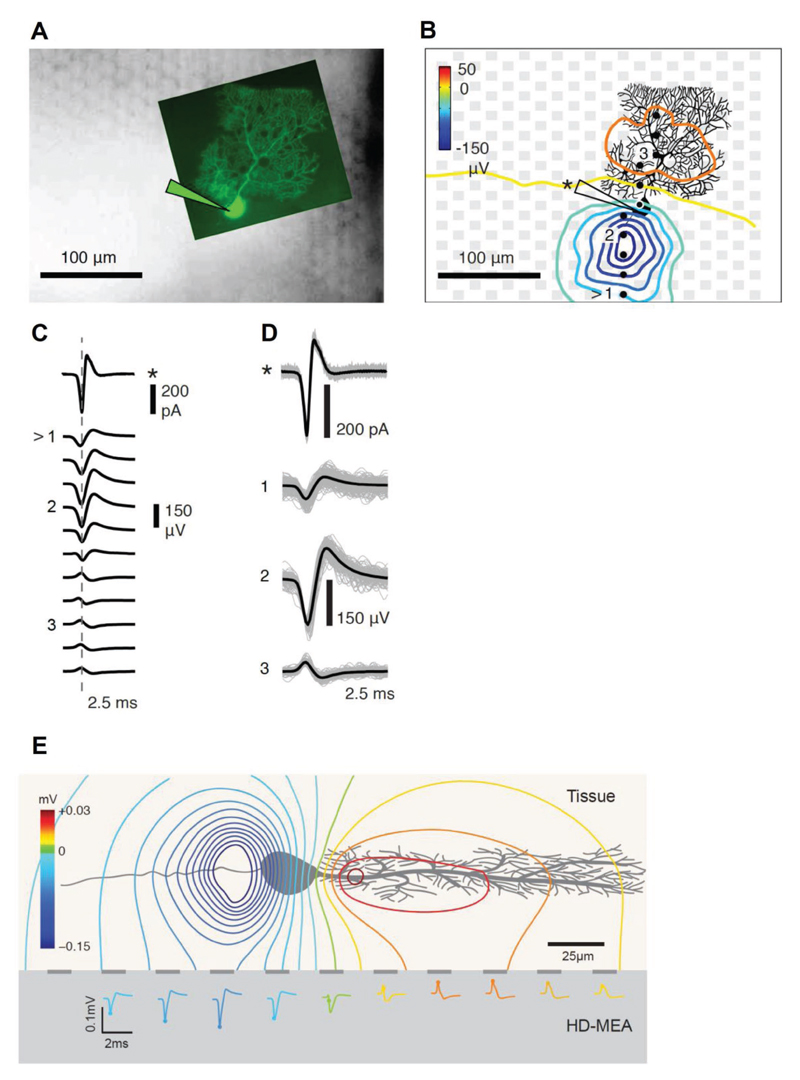
Figure 6. Combined cell-attached patch-clamp and high-density microelectrode array (HD-MEA) measurements show that the largest negative EAP of a Purkinje cell (PC) does not colocalize with the soma.
A) Fluorescence microscopy image of a measured Purkinje cell (PC), injected with Lucifer yellow, which was superimposed on an infrared differential-interference-contrast-microscopy image of the HD-MEA with an acute cerebellar slice with the focus on the electrode plane. B) Spatial distribution of the averaged spontaneous EAP of the Purkinje cell. The EAPs of the PC were extracted from HD-MEA recordings, while the timing of the action potentials has been obtained through cell-attached patch-clamp. The gray squares indicate the electrodes, while the recorded PC is displayed in black. The yellow line marks the border between the molecular layer (ML) and the Purkinje cell layer (see also Figure 5A). The black dots represent the locations of the electrodes from which the waveforms in (C) were obtained. The largest EAP amplitudes were found along the axon of the PC. C) Averaged action potential waveforms of a PC simultaneously obtained through cell-attached patch-clamp (marked with *) and extracted from the electrode array as EAP waveforms along the string of marked electrodes from the bottom to the top in (B). The arrow symbol (>) marks the beginning of the string of electrodes at the bottom. D) Averaged waveforms of three electrodes (labeled 1–3) and the patch-clamp measurement displayed in (C) superimposed on the detected individual traces of action potential currents (*) and EAPs. E) Side-view schematic of the estimated extracellular potential distribution of a PC in an acute tissue placed on top of an HD-MEA. The estimated EAP distribution and waveforms on the HD-MEA electrodes are shown.

