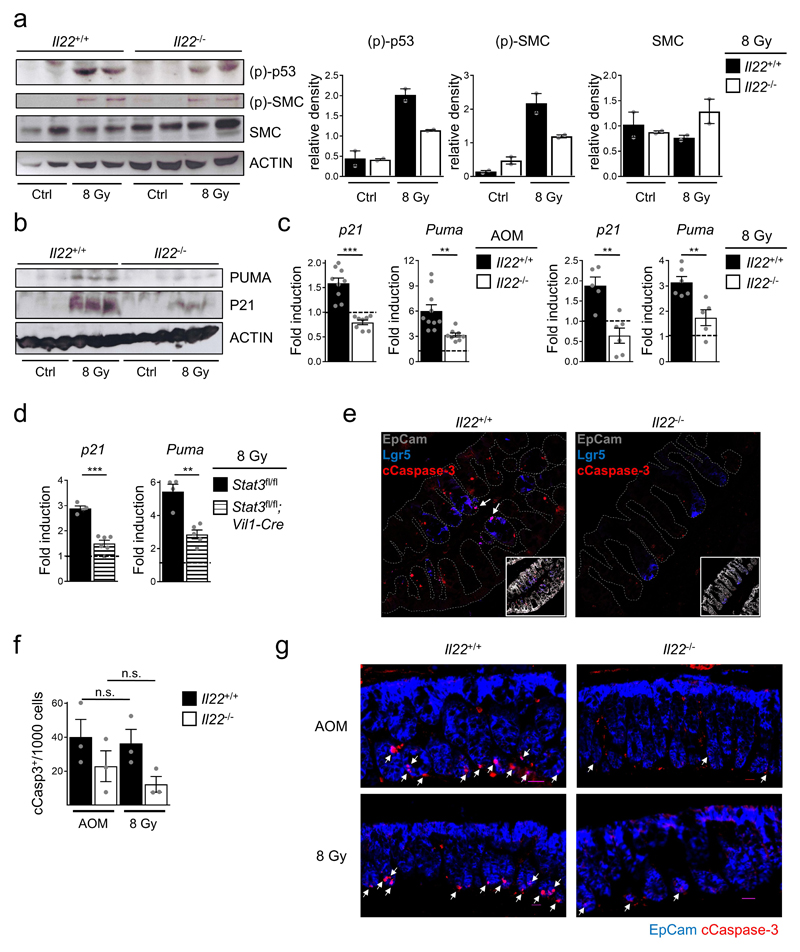
Extended Data Figure 7. Impairment of p53 activation and DDR effector genes in Il22-/- mice.
(a-g) Mice were irradiated with 8 Gy or injected with AOM. (a,b) Immunoblot analysis of the indicated proteins from primary colon epithelial cells 24h after irradiation. Densitometric quantification of signal intensity (mean±SEM, n=2). p-p53 and Actin, p-SMC and SMC, PUMA and Actin, and p21 immunoblots were derived from one gel each. Normalization was done to loading (p-p53, PUMA) or sample processing (p-SMC, SMC, p21) controls. (c,d) Fold induction of p21 and Puma gene expression in colon epithelial cells 24h after irradiation or AOM treatment was determined by qRT-PCR (AOM n=10, 8 Gy n=5, Stat3fl/fl n=4, Stat3fl/fl;Vil1-Cre n=5, mean±SEM). (e) Apoptosis (red: cleaved (c)Caspase-3) in Lgr5+ (blue) colon stem cells (arrows). Representative immunofluorescence images 8h after irradiation. (f,g) Quantification of cleaved Caspase-3+ EpCam+ colonic epithelial cells 8h after treatment with AOM or 8 Gy (f) (n=3, mean±SEM) and representative immunofluorescence images (g) (cleaved Caspase-3, red and EpCam, blue). Scale bar=25μm
Data are representative of two (d-g) or three (a-c) biologically independent experiments

