
Figure 1.
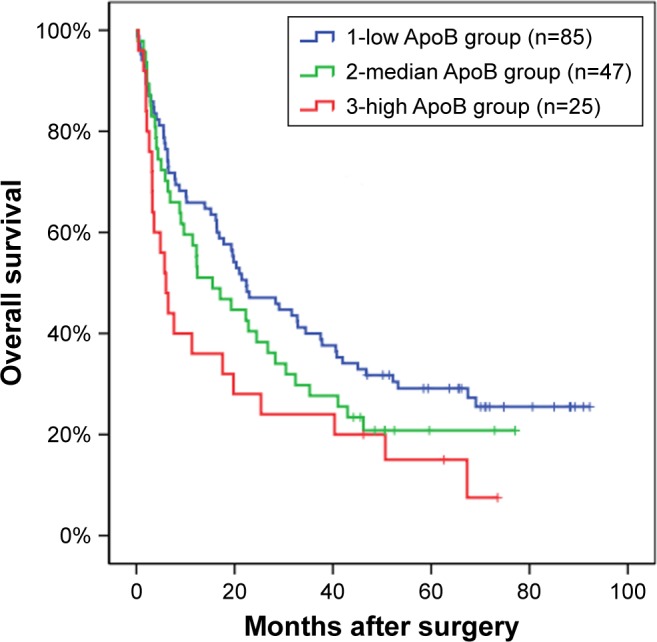
Comparison of overall survival rate among patients in three groups.
Notes: Group 1: patients with ApoB <0.8 g/L (n=85); group 2: patients with the ApoB level between 0.8 and 1.05 g/L (n=47); group 3: patients with the ApoB level >1.05 g/L (n=25). Log-rank test: group 1 vs 2, P=0.226; group 2 vs 3, P=0.193; group 1 vs 3, P=0.015.