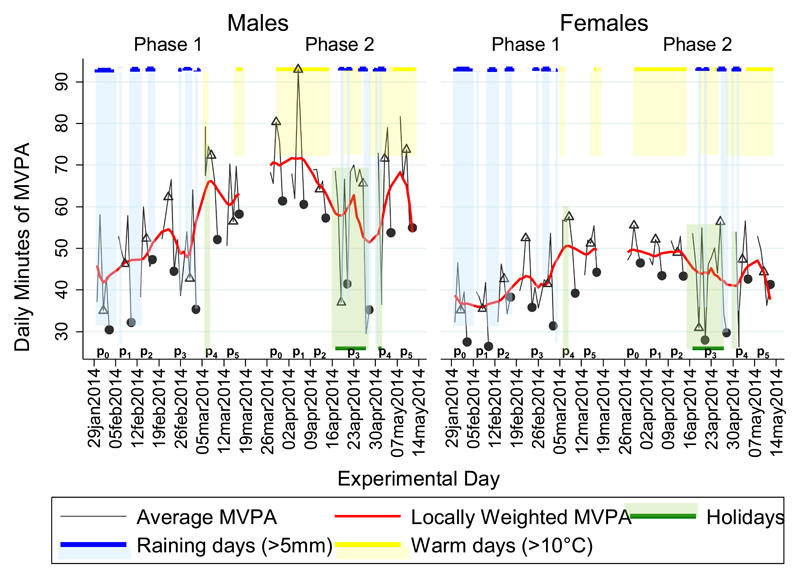
Fig. 3. Average Daily Minutes of Moderate to Vigorous Physical Activity (MVPA).
Data is aggregated and averaged at day-level for 92 and 85 females and for 84 and 88 males in Phases 1 and 2 respectively. Black line corresponds to the means of the actual MVPA while the red line are the estimates from a locally (with 0.3 bandwidth) weighted regression of MVPA on experimental days. Black dots and triangles indicate Mondays and Saturdays respectively. Blue, yellow and green shadowed days-periods highlight, rainy (precipitation more than 5mm), warm (temperature higher than 10°C) and holidays days/periods respectively.

