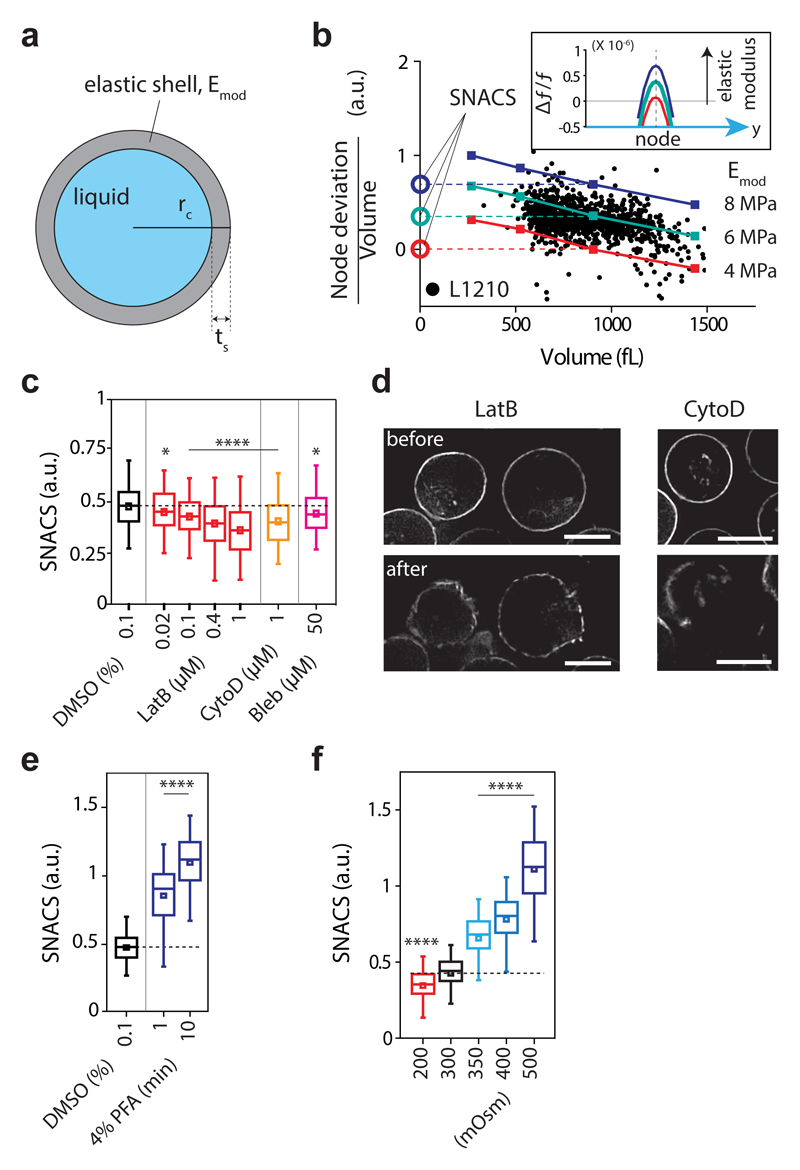
Figure 2. Size-normalized acoustic scattering (SNACS) measures changes in mechanical properties of cells.
a, Schematic of ‘Cortical Shell – Liquid Core’ model, where Emod is the elastic modulus of a shell. Cortical thickness (ts) was set to 2% of the cell radius (rc)45. b, Node deviation (volume-normalized) vs volume V from experiments with L1210 cells (black dots) and simulations using the model for three values of cortical elastic modulus (Emod, 4, 6 and 8 MPa, color lines). Vertical offsets of iso-elasticity lines define SNACS (Methods). Inset, Δf/f from simulations with different cortical elastic modulus (4, 6 and 8 MPa, V = 900 fL). c, SNACS obtained from L1210 cells treated with inhibitors of actomyosin cortex: Latrunculin B (LatB, 0.02, 0.1, 0.4 and 1 μM, n = 381, 385, 346 and 383 cells, respectively, P = 0.036, 3.8 × 10⁻⁵, 1.03 × 10⁻⁸ and 4.5 × 10⁻¹⁸, respectively), Cytochalsin D (CytoD, 1 μM, n = 332 cells, P = 1.2 × 10⁻⁸), and Blebbistatin (Bleb, 50 μM, n = 349 cells, P = 0.023). Statistical comparisons (two-sided Welch’s t-test) were made to DMSO control (0.1 %, n = 337 cells). d, Representative single z-layer images of F-actin (LifeAct) from live L1210 cells before and after 1 μM LatB (n = 9 fields of views) and 1 μM CytoD (n = 12 fields of views) treatment. Scale bars, 10 μm. e, SNACS of L1210 cells after crosslinking with 4% Paraformaldehyde (PFA, 1 and 10 min exposure, n=247 and 367 cells, respectively, P = 2.0 × 10-56 and 6.7 × 10-175, respectively). Statistical comparisons (two-sided Welch’s t-test) were made to DMSO control (0.1 %, n = 1047 cells). f, Effect of osmotic stress on SNACS. Cells were resuspended in hypo- (200 mOsm, n = 611 cells, P = 2.9 × 10⁻¹⁰) or hyperosmotic (350, 400 and 500 mOsm, n = 544, 571 and 574 cells, respectively, P = 8.1 × 10-65, 2.6 × 10-144 and < 10-200, respectively) media. Statistical comparisons (one-way ANOVA, Fisher’s LSD) were made to iso-osmotic (300 mOsm, n = 539 cells) media. In c,e,f, boxes: interquartile range, squares: mean, whiskers: 5-95%, horizontal dashed lines: mean SNACS of control (DMSO or 300 mOsm); *P < 0.05, ****P < 0.0001.

