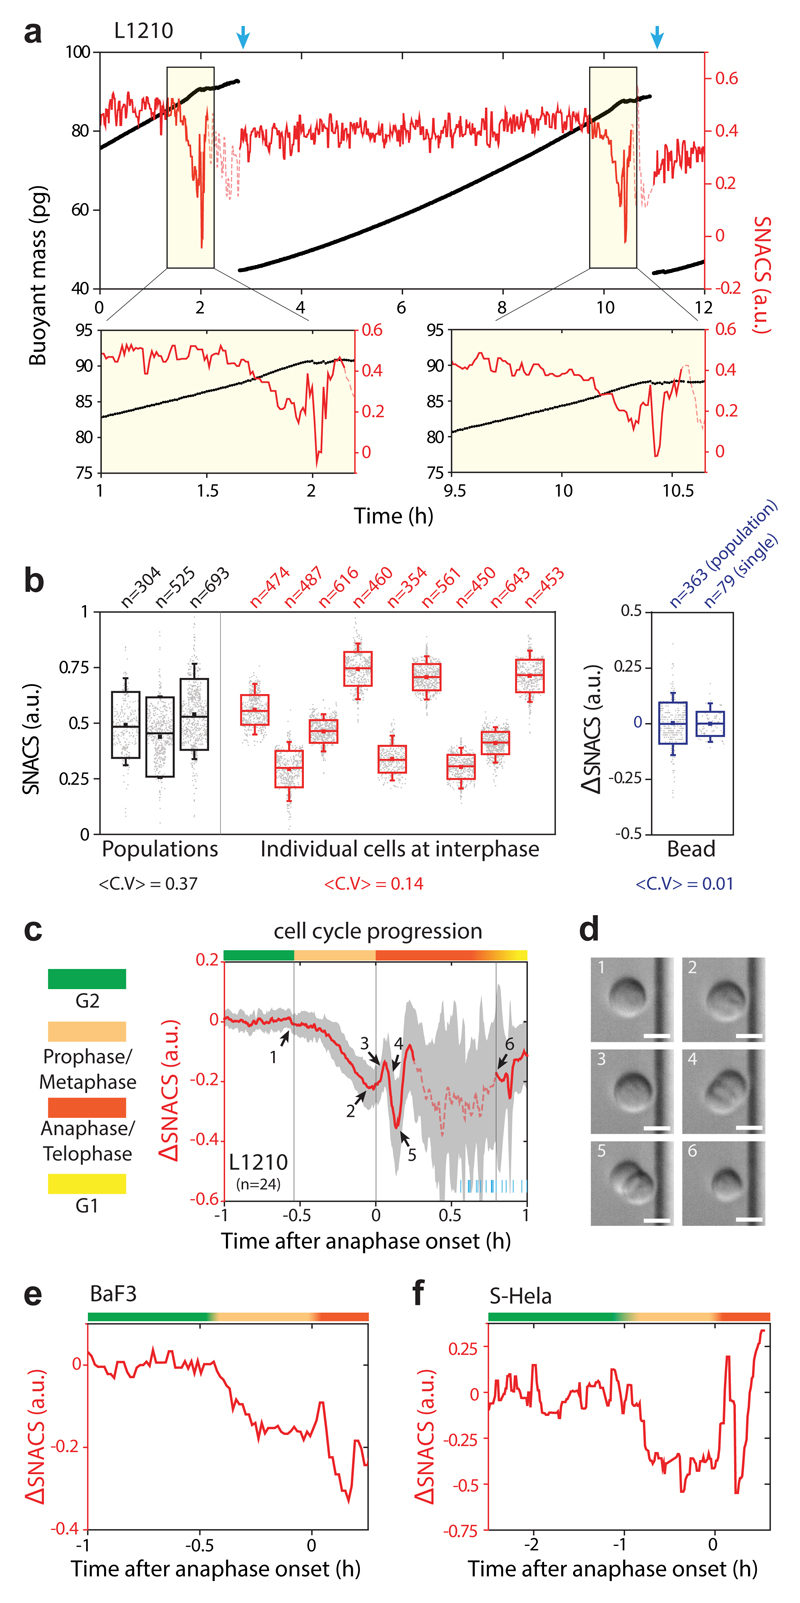
Figure 3. Continuous monitoring of single-cell SNACS throughout the cell cycle.
a, Top, buoyant mass (black) and SNACS (red) of a L1210 cell was measured over two cell divisions with < 1 min temporal resolution by flowing the cell back-and-forth through the SMR. Blue arrows mark cell division. Bottom, SNACS near mitosis. SNACS is shown in dashed lines when measurement error becomes statistically significant (Methods). b, SNACS variability during interphase at a cell population level (black), in individual cells (red), and for 12 µm polystyrene beads (blue). Bead SNACS is relative to its mean value. Large (mitotic) cells were removed from the population data. <C.V> is the average coefficient of variation. n is the number of cells (black) or beads (blue) measured from each population and the number of repeated measurements during interphase of each individual cell (red) or bead (blue). Boxes: ± s.d., squares: mean, whiskers: 5-95%. c, mean SNACS (red) and ± s.d. (gray) of L1210 cells during mitosis (n = 24 cells from 13 independent experiments). Vertical lines and color bars indicate the phase of the cell cycle. Short blue lines at the bottom right mark the end of cell division for each cell. Dashed line same as in a. d, Representative morphology of a L1210 cell (n = 24 cells from 13 independent experiments) captured by DIC imaging on the SMR chip. Numbering corresponds to arrows in c. Scale bars, 10 μm. e,f, SNACS in mamalian cells BaF3 (e) and S-Hela (f). Color bars same as in c.

