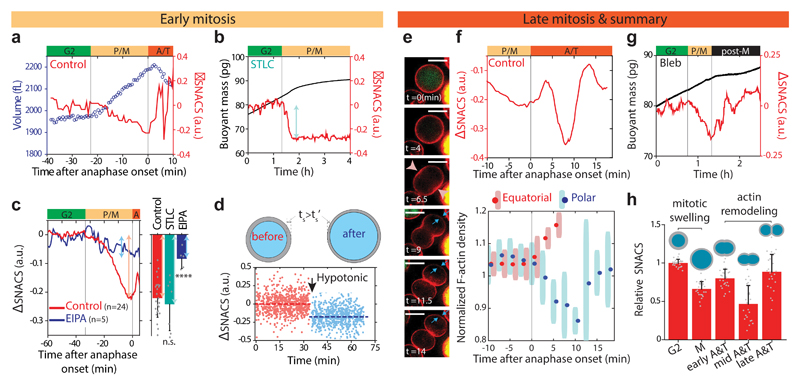
Figure 4. Mitotic swelling and actin remodeling are responsible for SNACS dynamics in mitosis.
a, L1210 cell volume (blue circles) and SNACS (red) in mitosis. b, Buoyant mass (black) and SNACS (red) of a L1210 cell arrested in metaphase by treating with S-trityl-cysteine (STLC, 5 μM). c, Left, mean SNACS change of control (red) and ethylisopropylamiloride (EIPA, 10 μM, blue) treated L1210 cells in early mitosis. Right, quantification of SNACS change with STLC (5 μM, n = 7 cells from 7 independent experiments, P = 0.58) and EIPA (10 μM, n = 5 cells from 5 independent experiments. P = 3.0 × 10⁻⁵) treatments. Data depicts mean ± s.d. of the maximal SNACS change in prophase and metaphase. Statistical comparisons (two-sided Welch’s t-test) were made to the control (n = 24 cells from 13 independent experiments). ****P < 0.0001, n.s., not significant. d, Top, illustration of hypothetical cortical thinning scenario by shell expansion during swelling (Supplementary Note 5). Bottom, SNACS of L1210 cells vs time before (red, n = 728 cells) and after (-Δ50 mOsm, blue, n = 733 cells) exposure to hypotonic stress. Dashed lines represent the mean SNACS of each condition. Arrow marks the time of osmotic shock. e, Representative single z-layer images of F-actin (red, LifeAct) and FUCCI (green, mAG-hGem) from a live L1210 cell (n = 7 cells). Time zero marks the onset of anphase. Furrow initiation in the equatorial region (pink arrowheads) and cortical relaxation at the poles (blue arrows) are highlighted. Scale bars, 10 μm. f, Top, zoom-in view of mean SNACS in late mitotic L1210 cells (n = 24 cells). Bottom, L1210 cortical LifeAct signal density in equatorial (red) and polar (blue) regions (Methods), as shown in e. Data depicts mean ± s.d. (n = 7 cells). g, Buoyant mass (black) and SNACS (red) of a L1210 cell treated with Blebbistatin (Bleb, 25 μM). h, Summary of SNACS dynamics in mitosis. Data depicts mean ± s.d. of the SNACS normalized to G2 (n = 24 cells). Actin (gray shell) and morphology of a cell in each time points of mitosis are illustrated. In a,b,c,f,g, vertical lines separate the cell cycle positions marked by color bars shown in Fig. 3c. Black bar marks post-metaphase. P: prophase, M: metaphase, A: anaphase, T: telophase, post-M: post-metaphase.

