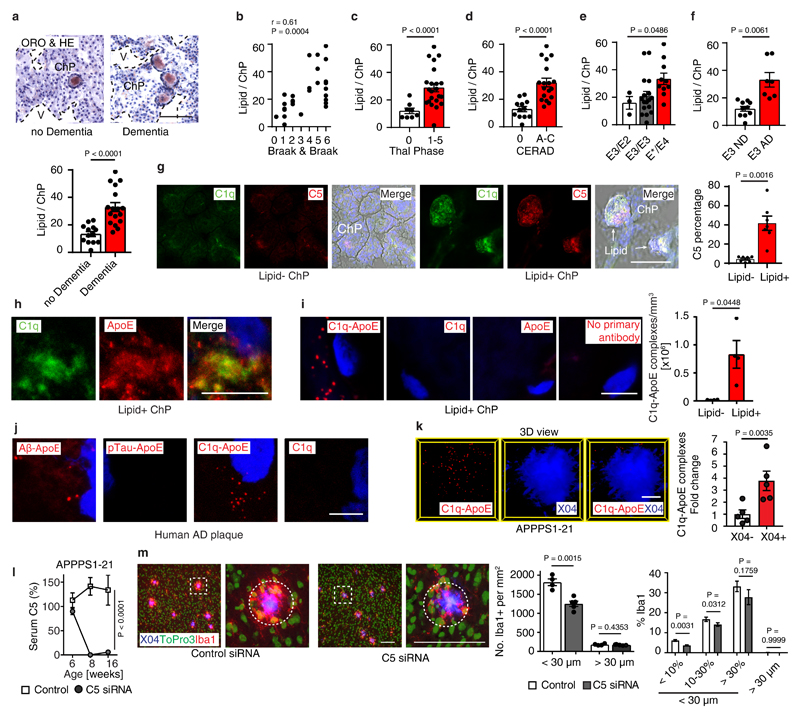
Figure 5. ChP C1q-ApoE complexes correlate with cognitive decline in Alzheimer's disease (AD).
(a) Human ChP sections were stained with ORO/HE. Bar 100 μm. ChPs lipid was quantified as described in Methods. Non-dementia cases (n=13) and demented cases (n=17). (b) Pearson correlation of ChP lipid and neurofibrillary tangle stage (Braak & Braak). n=30. (c-e) ChP lipid correlate with Aβ score (Thal phase), neuritic plaque score (CERAD), and ApoE4 genotype. n = 30 biologically independent samples, (f) ChP lipid correlates with dementia in ApoE3/ApoE3 carriers. ApoE3/ApoE3 Non-dementia cases (n=10) and demented cases (n=7). (g) Human ChP sections were stained for C1q (green) and C5 (red). Bar 100 μm. C5 percentage of lipid- ChP and lipid+ ChP from the same case was quantified according the Methods. Lipid- (n=7 biologically independent samples), lipid+ (n=7). (h) STED microscopy shows colocalization of C1q (green) and ApoE (red). Bar 5 μm. (i) Binding of C1q-ApoE in vivo by PLA. Anti-ApoE, anti-C1q, or no primary antibodies were used as controls. The number of C1q-ApoE complexes of lipid-negative ChP or lipid-positive areas were quantified as described in Methods. Lipid- (n=4 independent samples), lipid+ (n=4). Bar 5 μm. (j) Human brain sections were stained for Aβ/ApoE, pTau/ApoE, C1q/ApoE, or C1q alone. Protein-protein binding in vivo was detected by PLA. Blue for nuclei. Bar 5 μm. (k) 16 weeks AD (APPPS1-21) brain cortex sections were examined by the PLA assay for the presence of C1q/ApoE complexes, methoxy X04 to outline plaques. X04-(5), X04+ (5). Bars represent 10 μm. (l) Liver-targeted C5 siRNA reduces serum C5 in APPPS1-21 mice. Ctr (n=4 mice), C5 (n=5). (m) Brain sections were stained with iba1 for microglial cells (red), To-Pro-3 for nuclei, and X04 for Aβ plaque. White dashed circle represents the area within a 30 μm radius. The number of iba1+/To-Pro-3+ cells per areawere quantified (> 30 μm radius represents non-Aβ plaque area). Plaques were further grouped into small plaques (X04% < 10% of 30 μm radius area), moderate plaques (X04% between 10 - 30% 30 μm radius area), and large plaques (X04% > 30% of 30 μm radius area). Percentage of iba1 positivity within a 30 μm radius of Aβ plaques and non-Aβ plaque areas were compared. 420 individual Aβ plaques and 40 fields of non-Aβ plaques from 4 control mice, 536 individual Aβ plaques and 51 fields of non-Aβ plaques from 5 C5 treated mice. Data in h,j are representative images from at least 3 independent samples. Data represent means ± SEM. Two-tailed Student´s t-test was applied to a,c,d,f; paired two-tailed Student´s t-test was applied to g,I,k; One-way ANOVA was applied to e; Two-way ANOVA was applied to l,m.

