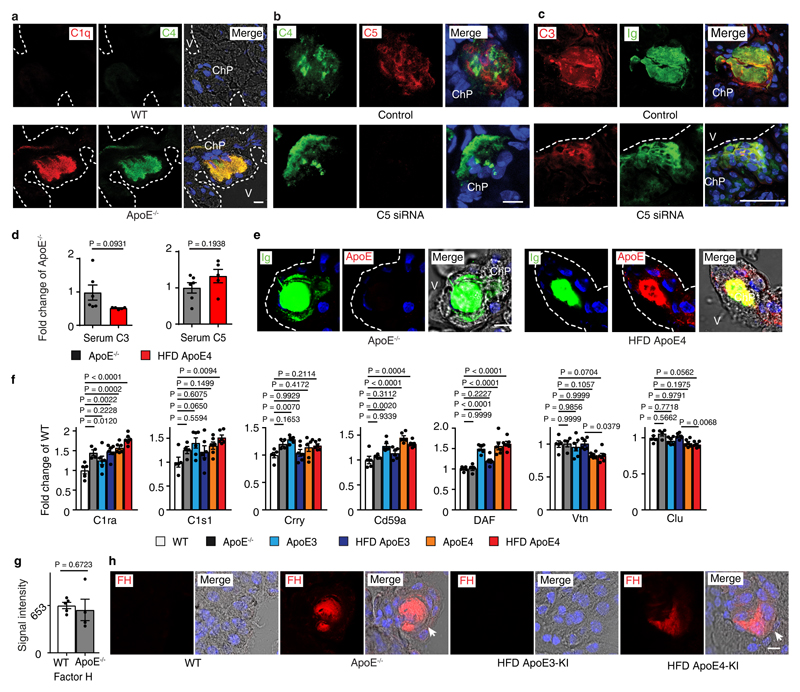
Extended Figure 2. Complement constituents in mouse ChPs.
(a) ChPs were stained for C1q (red) and C4 (green). Bar 100 µm. (b) C5 siRNA treatment blocks C5 protein deposition in ApoE-/- ChPs; (c) ChPs were stained for C3. Ig represents lipid; (d) Serum C3 and C5. Serum C3 and C5 protein levels were measured by ELISA. ApoE-/-(n = 6 mice), HFD ApoE4 (n=5). (e) High resolution confocal microscopy shows colocalization of ApoE4 (ApoE, red) and Ig (green, represents lipid) in HFD ApoE4-KI ChPs. ApoE-/- ChPs serve as negative controls for ApoE staining; (f) Complement regulators are expressed in ChPs. WT (n = 5 mice); ApoE-/-(n=4); ND ApoE3 (n=6); HFD ApoE3 (n=6); ND ApoE4 (n=6); HFD ApoE4 (n=6). (g) ChP Factor H expressed between WT and ApoE-/- mice. WT (n=5); ApoE-/-(n=4); (h) ChP factor H protein in ChPs. White arrows indicate lipid positive areas. Data in a,b,c,e,h are representative images from at least 3 biologically independent mouse samples. Data in d,f,g represent means ± SEM; Two-tailed Student's t-test was applied to d,g; one-way ANOVA with Tukey posttest was applied to f; Gene names in Supplementary Table 3.

