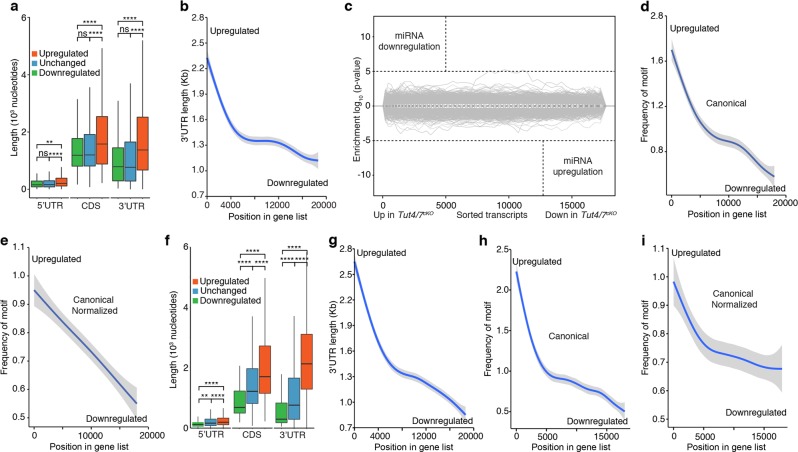
Fig. 6.
TUT4/7 target transcripts in pachytene spermatocytes and GV oocytes that are enriched for AU-rich elements in long 3′ UTRs. a Box plot of 5′UTR, CDS and 3′UTR length for downregulated, unchanged and upregulated transcripts in Tut4/7cKO pachytene cells. The center value represents the mean length, and the upper and middle hinges the first and third quartiles, respectively. (ns not significant, **P < 0.01, ****P < 0.0001, Wilcoxon test two-sided). b GAM fit of 3′UTR length to the ranked position of genes according to their differential expression in Tut4/7cKO pachytene cells. Genes are ranked from upregulated to downregulated. c Sylamer analysis of miRNA signatures for transcripts ranked according to changes in expression between Tut4/7CTL and Tut4/7cKO pachytene cells. d GAM fit of the frequency of the canonical AU-rich element AUUUA to transcripts ranked according to changes in expression between Tut4/7CTL and Tut4/7cKO pachytene cells. e GAM fit as in d where the frequency of the motif is normalized to the length of the 3′UTR. f Box plot of 5′UTR, CDS and 3′UTR length for downregulated, unchanged and upregulated transcripts in Tut4/7cKO GV oocytes. The center value represents the mean length, and the upper and middle hinges the first and third quartiles, respectively. (**P < 0.01, ****P < 0.0001, Wilcoxon test two-sided). g GAM fit of 3′UTR length to the ranked gene position according to differential expression in Tut4/7cKO GV oocytes. Genes are ranked from upregulated to downregulated. h GAM fit of the frequency of the canonical AU-rich element AUUUA to transcripts ranked according to changes in expression between Tut4/7CTL and Tut4/7cKO GV oocytes. i GAM fit as in h where the frequency of the motif is normalized to the length of the 3′UTR

