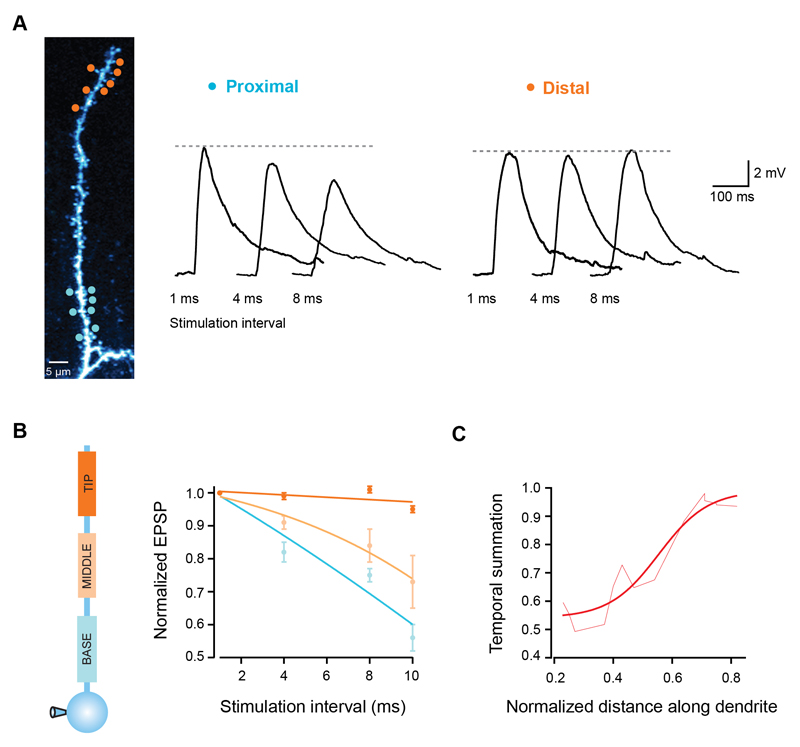
Figure 3. Temporal summation gradient along pyramidal cell dendrites.
(A) Seven uncaging spots were placed either at the tip (orange circles) or close to the branchpoint of a single dendrite (blue circles), and activated with different degrees of synchrony. Traces show somatic EPSPs in response to increasing stimulation intervals for both locations. Note the invariance of the EPSP peak for distal synapses. (B) EPSP peak normalized to the response for 1 ms intervals for 3 different regions of single dendrites. Lines are fits to the data. (C) Temporal summation increases towards the dendritic tip (measured as the EPSP peak at 10 ms interval normalized to the response at 1 ms interval). Smooth line is a sigmoid fit.

