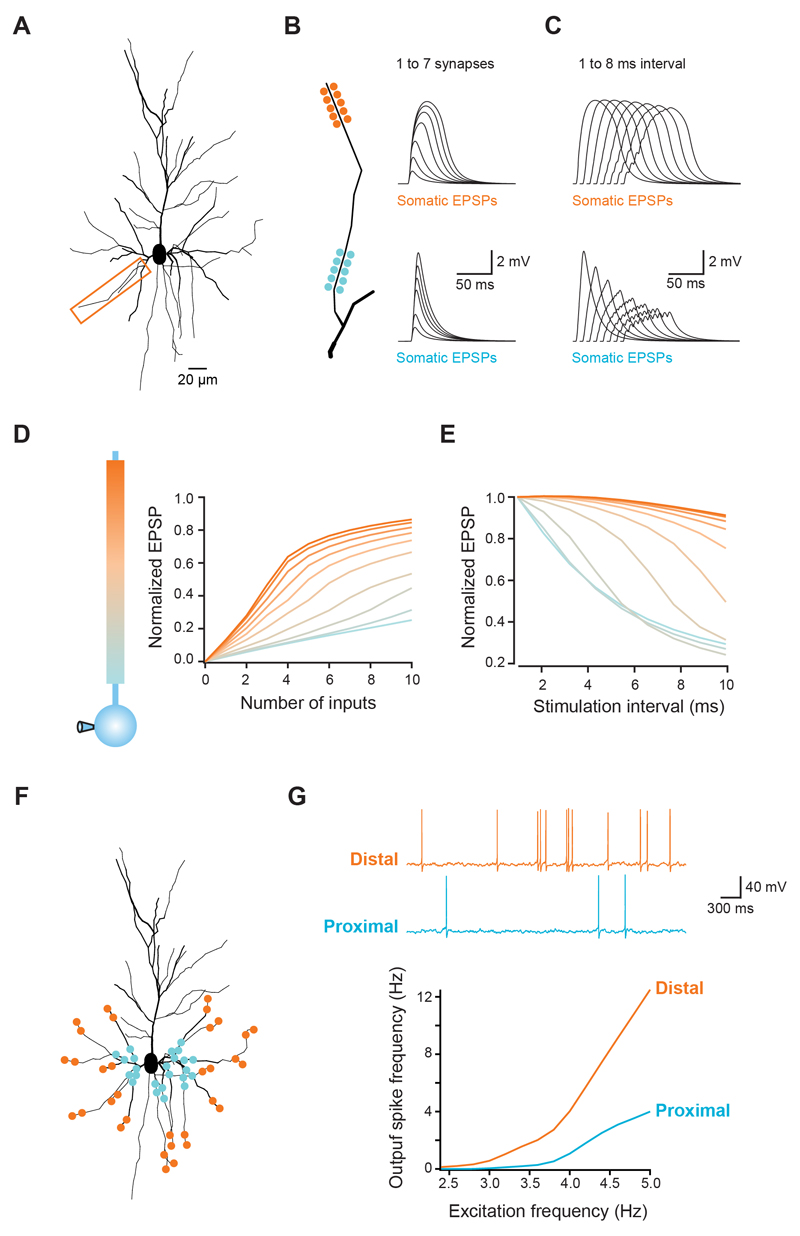
Figure 5. Modelling the impact of dendritic integration gradients on neuronal output.
(A) Morphology of a reconstructed layer 2/3 pyramidal used for simulations. Box indicates dendrite used in B-E. (B,C) Clusters of synapses were placed at different locations along the dendrite (total length = 90 μm). (B) Increasing number of synapses were activated or (C) all synapses activated at different intervals. Traces show somatic voltage responses for proximal (bottom) and distal synapses (top), which reproduce the experimental data (see Figure 1A and 2A). (D,E) Summary for all tested locations in the model, showing the same gradients for the gain of the input-output function (D) and temporal summation (E) that were observed experimentally. (F) Schematic illustration of 169 synapses randomly distributed across all basal dendrites, with either a distal or a proximal bias. (G) Each synapse was activated with independent Poisson trains of increasing frequency and the somatic voltage monitored. As the excitation frequency increases, the spiking frequency increases more rapidly for distally distributed synapses. Traces show responses for distal (orange) and proximal (blue) distributions stimulated at 4 Hz.

