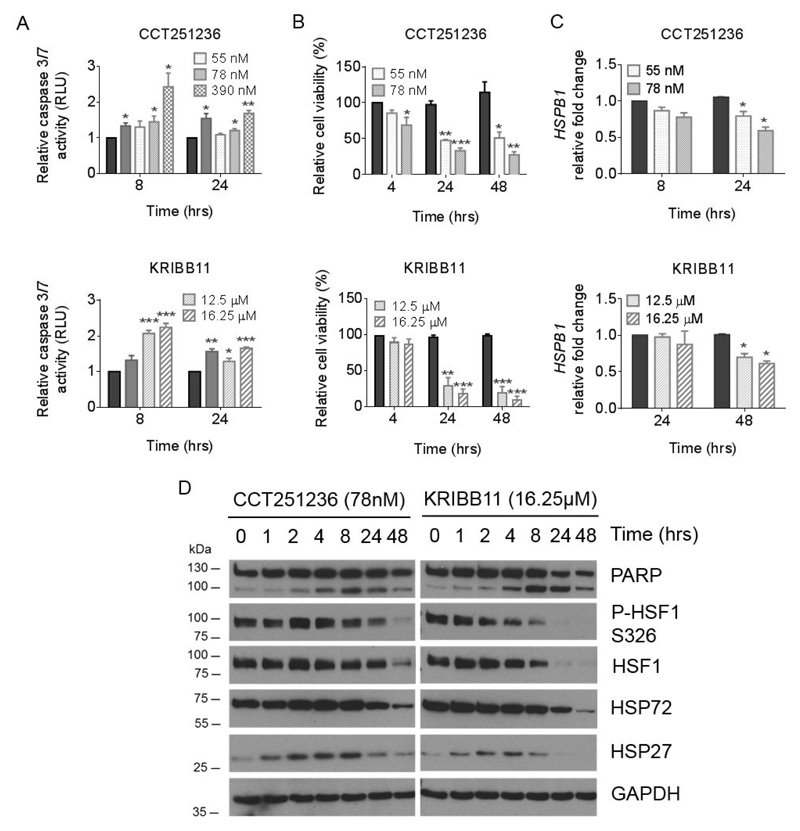
Figure 3. CCT251236 and KRIBB11 treatment induces caspase-mediated cell death concomitant with the downregulation of HSF1 target genes.
Human RPMI-8226 myeloma cells were treated with CCT251236 or KRIBB11 at concentrations corresponding to the 48 hour GI25 and GI50 values. (A) Caspase 3/7 activity was detected by the Caspase-Glo® assay. Graphs represent RLU relative to the vehicle-treated control. Cells treated with 5 nM bortezomib for 24 hours (solid grey bars) were used as positive controls for caspase activity. (B) Cells were analyzed by flow cytometry following staining with Annexin V-APC and PI over a 48 hour time course. Graphs represent Annexin V-APC and PI negative cells as a percentage of the vehicle-treated control. (C) HSPB1 mRNA expression normalized to GAPDH mRNA presented relative to vehicle-treated controls. For all bar graphs, solid black bars represent vehicle-treated controls at indicated time points. Data are shown as means ±S.E.M. of three independent experiments. Significant differences were calculated by Student’s t-tests and P-values are indicated where * ≤ 0.05, ** ≤ 0.01, and *** ≤ 0.001 compared with vehicle-treated control at the same time point. (D) Western blot of whole cell lysates from RPMI-8226 cells treated with KRIBB11 or CCT251236 over a 48 hour time course. Membranes were probed with antibodies against PARP, HSF1, phospho-HSF1 (P-HSF1) at Ser236 (S326), HSP72, HSP27, with GAPDH as a loading control.

