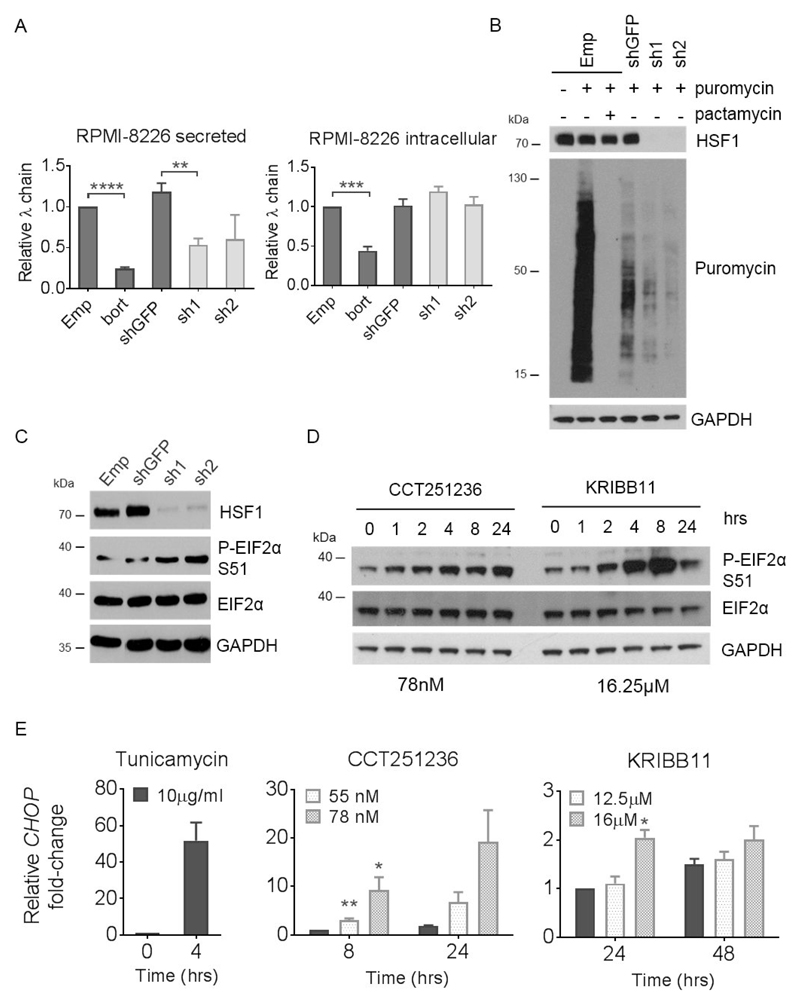
Figure 4. HSF1 silencing and HSF1 pathway inhibition leads to a downregulation of global protein synthesis concomitant with eIF2α phosphorylation and CHOP expression.
Human RPMI-8226 myeloma cells were transduced with HSF1 shRNA (sh1 and sh2) and empty pLKO.1 vector (Emp) or GFP shRNA (shGFP) as controls for 72 hours. (A) Relative levels of secreted and intracellular λ Ig light chains produced over a 24 hour period following HSF1 silencing were analysed by ELISA. shGFP cells treated with bortezomib (bort) for 24 hours were used as a positive control for a reduction in secreted and intracellular light chains. (B) Relative protein synthesis was determined by Western blot of cells treated with 4 μg/ml puromycin for 10 mins following HSF1 silencing. Cells pre-treated with 10 μM pactamycin, a ribosome inhibitor, for 15 minutes were used as controls for reduced protein synthesis. Membranes were probed with antibodies against puromycin and HSF1. (C) Levels of phospho-EIF2α (P-EIF2α) at Ser 51 (S51) from RPMI-8226 whole cell lysates following HSF1 silencing were also determined by Western blot. (D) Levels of P-EIF2α were also analysed by Western blotting of whole cell lysates extracted from RPMI-8226 cells treated with CCT251236 or KRIBB11 over a 48 hour timecourse. GAPDH was used as a loading control. (E) CHOP mRNA expression quantified by q-PCR from RPMI-8226 following 48 hours CCT251236 or KRIBB11 treatment. Cells treated with 10μg/ml tunicamycin for 4 hours were used as positive controls. Graphs represent CHOP expression fold-change relative to vehicle-treated controls. Data are shown as means ±S.E.M. of three independent experiments. Significant differences were calculated by Student’s t-tests and P-values are indicated where * ≤ 0.05, ** ≤ 0.01, *** ≤ 0.001 and **** ≤ 0.0001.

