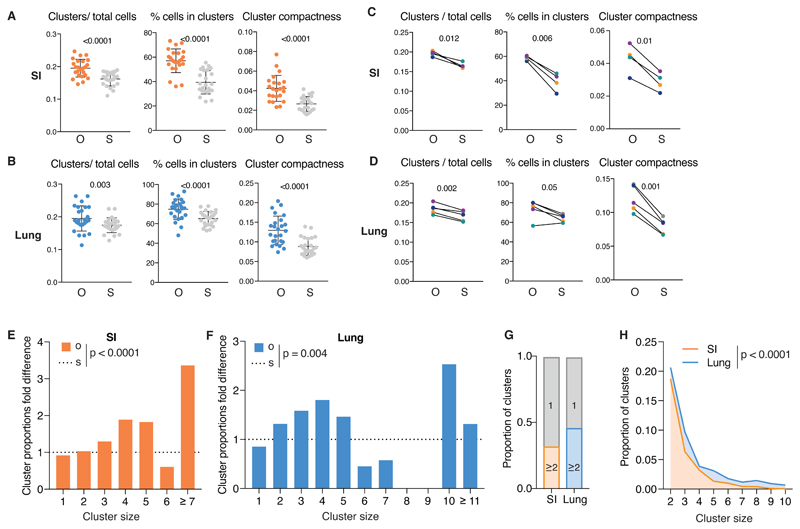
Fig 4. SI and lung cDCs are organized in spatially-restricted clusters of sister cells.
(A) From left to right: number of clusters of 2 or more cells normalised to number of cells, percentage of number of cells in clusters and cluster compactness from 24 images of SI from 4 mice. Each point represents one image; observed (O), orange, compared to simulations (S), grey. (B) As in (A) from 25 lung images from 5 mice. (C) Data from (A) grouped per mouse. Lines link the observed and simulated scenarios associated with each mouse. Colors correspond to individual mice (observed (O) and simulation (S)). (D) Data from B grouped per mouse as for C. (E-F) Proportion of clusters of the indicated size in observed scenario (O, orange) normalised to the simulated scenario (S, dashed line). Data are from SI (E) or lung (F) of a representative mouse. Other mice are shown in Fig. S4. (G) Proportion of all clusters analysed of size 1 (grey) or ≥2 in SI (orange) or lung (blue).. (H) Comparison of proportion of clusters of size 2 to 10 in the SI (orange) and in the lung (blue). In all cases, CD64 staining was used to exclude CD64+ cells from the analysis.. Statistical analysis in (B-E) used a paired t-test and in (F-G) used a chi-squared test.

