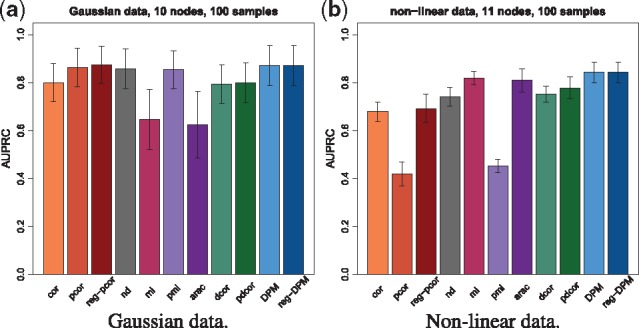
Fig. 2.

Performance on simulated data. The plots show the average AUPRCs of all selected methods. Error bars show one standard deviation. (a) Gaussian data. The expected AUPRC on this task is 0.27. (b) Non-linear data. The expected AUPRC on this task is 0.2
