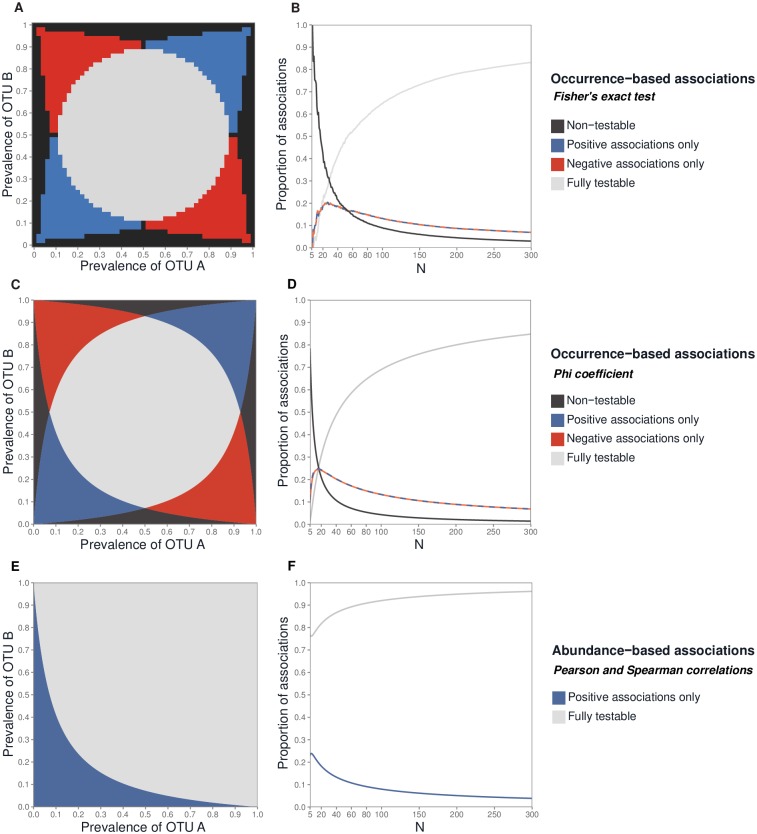
Fig 1. Testability of pairwise associations for the occurrence data and for the read abundance data.
For the occurrence data: the testability zones defined by OTU prevalence for the Fisher’s exact test (A), and the proportion of testable associations as a function of N assuming prevalence follows a uniform distribution (B). Testability zones defined by OTU prevalence for the Phi coefficient (C), and the proportion of testable associations as a function of N assuming prevalence follows a uniform distribution (D). For the read abundance data: testability zones defined by OTU prevalence for the Pearson and Spearman correlation coefficients (E), and the proportion of testable associations as a function of N assuming prevalence follows a uniform distribution (F). The alpha level for the tests was 5%. For (A), (C) and (E), N = 50.

