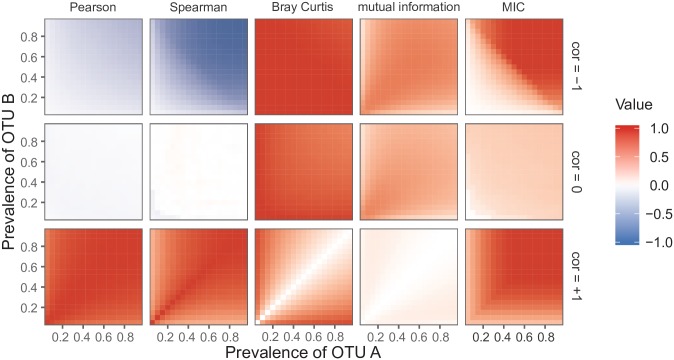
Fig 4. Relationship between OTU prevalence and the responses of five association measures for a simulated dataset.
Two zero-inflated negative binomial (ZINB) distributions (N = 50, μ = 1000, θ = 0.5, p0 = 1 − prevalence) were created using all pair of prevalences from 0.05 to 0.95 (steps of 0.05) and for three correlation levels. For the graphs, the correlation level is −1 in the first row, 0 in the second row, and +1 in the third row. The five association measures are represented in different columns. A total of 100 simulations were performed, and the median values were plotted.

