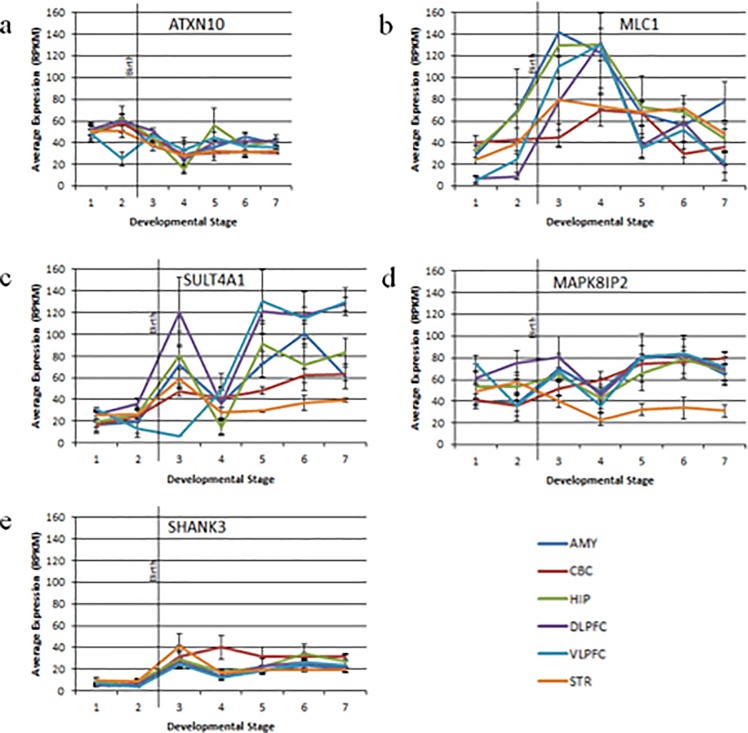
Fig 4. Average expression across time and space.
The expression profile for each candidate gene across developmental time in six different brain regions (AMY, CBC, HIP, DLPFC, VLPFC, STR) is shown in a-e (a: ATXN10, b: MLC1, c: SULT4A1, d: MAPK8IP2, e: SHANK3). The black vertical line represents birth. Error bars represent the standard error of the mean. AMY = amygdala, CBC = cerebellum, HIP = hippocampus, DLPFC = dorsolateral prefrontal cortex, VLPFC = ventrolateral prefrontal cortex, STR = striatum.

